|

IOTA Price Forecast: IOT/USD sold-off amid rising wedge breakdown, bearish RSI divergence

  • IOT/USD slides as technical set up turns in favor of bears.
  • Sellers target 100-HMA support amid bearish RSI.
  • 21-HMA to limit the recovery attempts in IOTA.    

IOTA (IOT/USD) stalls the sharp sell-off to 0.2515, as the bears take a breather before the next push lower.

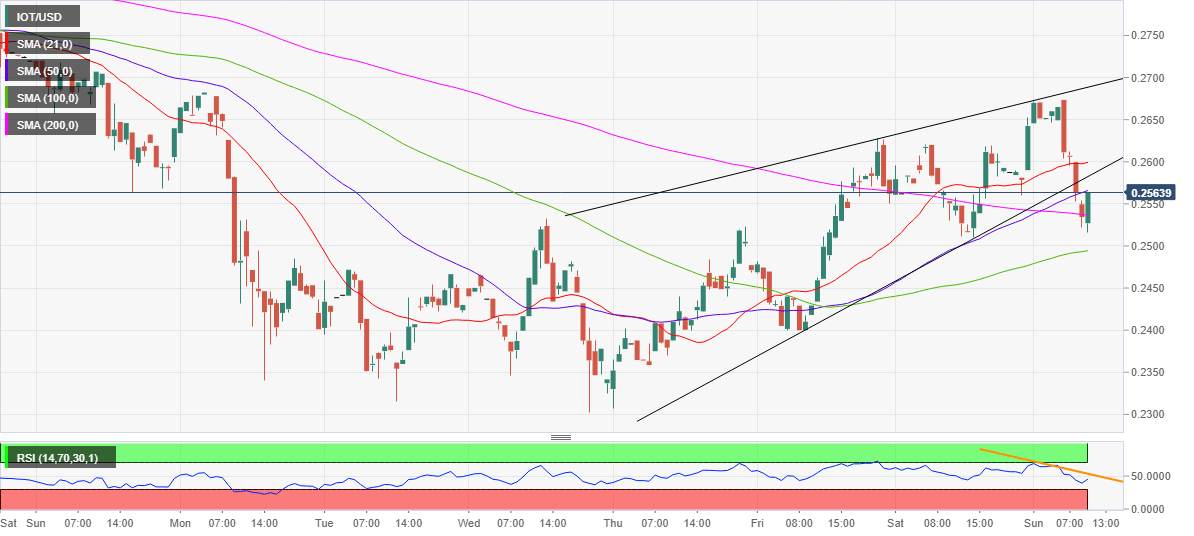
As observed on the hourly chart, the coin came under fresh selling pressure from near 0.2670 region after a death cross got confirmed early Sunday. The bearish crossover appeared after the 200-HMA pierced the 50-HMA from above.

Also, the price-Relative Strength Index (RSI) bearish divergence added credence to the downside.

The sell-off gathered traction after the bears took out the 21-hourly Simple Moving Average (HMA) support, then at 0.2598.

Subsequently, the downside pressure intensified, validating a rising wedge breakdown below the rising trendline support at 0.2575. Further south, the price penetrated through the critical 50 and 200-HMA.

At the moment, the price has recaptured the 200-HMA at 0.2536, now flirting with the 50-HMA at 0.2569 on the road to recovery.

The tepid bounce can be attributed to the upturn in the hourly RSI, currently at 45.29. The next upside resistance is seen at the pattern support now resistance at 0.2580.

The bearish bias remains intact so long as the spot holds below the 21-HMA.

To the downside, the daily low could be retested should the sellers regain control, below which the floors open up towards the 100-HMA at 0.2494  en route the pattern target of 0.2302.

IOT/USD: Hourly chart
fxsoriginal

IOT/USD: Additional levels to consider

IOT/USD

Overview
Today last price0.25632
Today Daily Change-0.00786
Today Daily Change %-2.97
Today daily open0.26425
 
Trends
Daily SMA200.27081
Daily SMA500.32582
Daily SMA1000.29001
Daily SMA2000.23484
 
Levels
Previous Daily High0.26528
Previous Daily Low0.25099
Previous Weekly High0.272
Previous Weekly Low0.23028
Previous Monthly High0.44
Previous Monthly Low0.2757
Daily Fibonacci 38.2%0.25982
Daily Fibonacci 61.8%0.25645
Daily Pivot Point S10.25507
Daily Pivot Point S20.24588
Daily Pivot Point S30.24078
Daily Pivot Point R10.26936
Daily Pivot Point R20.27446
Daily Pivot Point R30.28365

Author

Dhwani Mehta

Dhwani Mehta

FXStreet

Residing in Mumbai (India), Dhwani is a Senior Analyst and Manager of the Asian session at FXStreet. She has over 10 years of experience in analyzing and covering the global financial markets, with specialization in Forex and commodities markets.


More from Dhwani Mehta
Share:

Editor's Picks

Aave Price Forecast: Bearish RSI divergence risks a 20% drop despite steady DeFi deposits

Aave (AAVE) extends a mild near-term recovery, holding above its 50-day Exponential Moving Average at $90.80. Aave protocol’s V3 deployment on Monad blockchain recorded over $500 million in deposits over the last month, reflecting increased user adoption.

Dogecoin Price Forecast: Bullish divergence hints at DOGE recovery

Dogecoin (DOGE) steadies near $0.070 after falling 3.5% last week. While the broader trend remains bearish, improving derivatives metrics and bullish divergences in momentum indicators suggest that selling pressure may be easing, hinting at a potential recovery. Derivatives data shows bullish sentiment among Dogecoin traders.

Top Altcoins Price Forecast: Ripple nears triangle breakout while Cardano, Hyperliquid rebound

Ripple trades above $1.00, approaching the apex of a symmetrical triangle pattern. Cardano and Hyperliquid hold steady, sustaining gains from the recent rebound. The technical outlook for XRP is mixed while ADA and HYPE maintain a bullish bias. XRP maintains a mixed tone on the daily chart, trapped between two converging trendlines forming a symmetrical triangle pattern.

Ripple and Stellar outlook: XRP and XLM steady as derivatives data points to easing downside pressure
Ripple (XRP) and Stellar (XLM) show mixed price action on Tuesday, with XRP holding above the key $1 support zone while XLM faces rejection at $0.173. Meanwhile, improving derivatives metrics alongside fading bearish momentum suggest that the downside pressure may be easing for both altcoins. Derivatives data shows mild bullish sentiment among traders.
Bitcoin: Bulls hold the line
Bitcoin (BTC) edges slightly lower, trading at $64,300 at the time of writing on Friday but holding firmly above a key support zone. US-listed spot Bitcoin Exchange Traded Funds (ETFs) support BTC as they continued to attract institutional flows through Thursday, pointing to the fourth consecutive week of net inflows.