How investors can survive the ongoing Binance Coin price massacre
- Binance Coin price depends on the buyer congestion at $260 to consolidate losses from $299.
- Large volume holders are ready to buy BNB as the token slides into a buy zone.
- A potential rectangle pattern breakout points to an extended freefall in BNB price.
Binance Coin price is at a crossroads after suffering the aftermath of last week’s $100 million hack attack on its BSC (Binance Smart Chain) protocol. Prior, the native exchange token had regained ground from $260 (current support) and almost brushed shoulders with the $300 level. However, an initial subtle retracement from $299 left no stone unturned as BNB price plunged in search of substantial support.
Binance Coin is at a critical juncture
Binance Coin price has been trading sideways between $300 and $260 since mid-September. Due to this generally directionless trend, a rectangle pattern formed, as illustrated on the 12-hour chart below.
Rectangle patterns symbolize a period where buyers and sellers are consolidating their positions or are still undecided. Hence, they resort to throwing punches, but neither is strong enough to determine the next breakout’s direction.
Binance Coin price will continue testing the upper limit resistance and lower limit support before finally breaking out, either to the upside or downside. A bear rectangle pattern, like in the case of BNB price, forms when the price consolidates during a downtrend. Sellers use the consolidation period to pause, perhaps catching their breath before pushing the price lower.
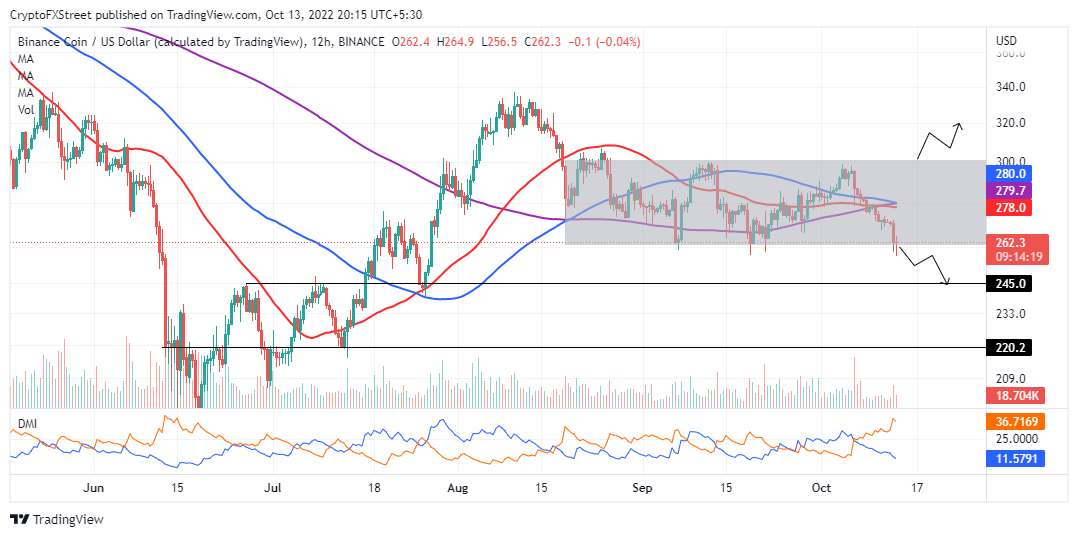
BNB/USD 12-hour chart
With a southbound breakout around the corner, traders should prepare their short positions. That said, they must wait for BNB price to make a small break below the rectangle support before activating the sell orders.
The Directional Movement Index (DMI) position compels investors not to trade against the trend, especially with the -DI expanding the divergence above the +DI. Two potential take profit points to the downside lie at $245 and $220, respectively.
Binance Coin price is back in the buy zone but should you buy now?
The market value realized value (MVRV) by Santiment, currently below the mean line (0%), peaked at 22.95% on September 10 when BNB price tagged $299. Usually, a reading above the mean line indicates that BNB is overvalued. For this reason, investors tend to sell for profit.
 [17.01.43, 13 Oct, 2022]-638012727527003692.png)
Binance Coin MVRV ratio
Meanwhile, with the MVRV ratio sliding to -3.78%, BNB holders will likely incur unrealized losses, which may compel them not to sell until the price shoots up. As the selling pressure wanes, buyers are expected to take the reins and guide Binance Coin north of support at $260.
 [17.01.36, 13 Oct, 2022]-638012727002086232.png)
Binance Coin Supply Distribution
Investors with between 10,000 and 100,000 BNB tokens appear to seize the moment to fill their bags as Binance Coin price bleeds. From the above chart, this cohort of whales holds 3.32% of the network’s total supply, up from 3.23% on September 21 and 3.14% on July 4. This suggests BNB price will regain its balance at $260 if whales and other previously sidelined investors continue to beef up demand for the token.
Author

John Isige
FXStreet
John Isige is a seasoned cryptocurrency journalist and markets analyst committed to delivering high-quality, actionable insights tailored to traders, investors, and crypto enthusiasts. He enjoys deep dives into emerging Web3 tren


