How Dogecoin price will react as nearly 50% of all investors are underwater
- Dogecoin price is hovering below the $0.062 target, hinting at a continuation of the downtrend.
- Investors must be prepared for a 17% crash if sellers continue to offload their holdings.
- A daily candlestick close above $0.062, on the other hand, could see DOGE rally 16% to $0.073.

Dogecoin price shows that the crash is likely to continue until a stable support level is reached. Investors need to be cautious for the next few days, at least until sellers and the bearish momentum dissipate.
Dogecoin price to realize more losses
Dogecoin price has breached the descending triangle formation formed since May 12. Additionally, the excessive selling pressure has pushed DOGE past its target at $0.062 to where it currently trades - $0.056.
The $0.062 target is attained by projecting the 18% distance between the first swing high and the swing low to the breakout point at $0.076.
Due to the overwhelming sell-side pressure in the crypto markets, altcoins, including Dogecoin price have dropped uncontrollably. As DOGE trades around $0.056, the chances that this move will continue are high.
In such a case, investors should be prepared for a further 17% crash to the $0.046 support level. This barrier was a significant launching pad in early 2021 that helped the meme coin rally 1,500% in the next few weeks.
Therefore, market participants can expect sidelined buyers to step in at this level and cauterize the bleed.
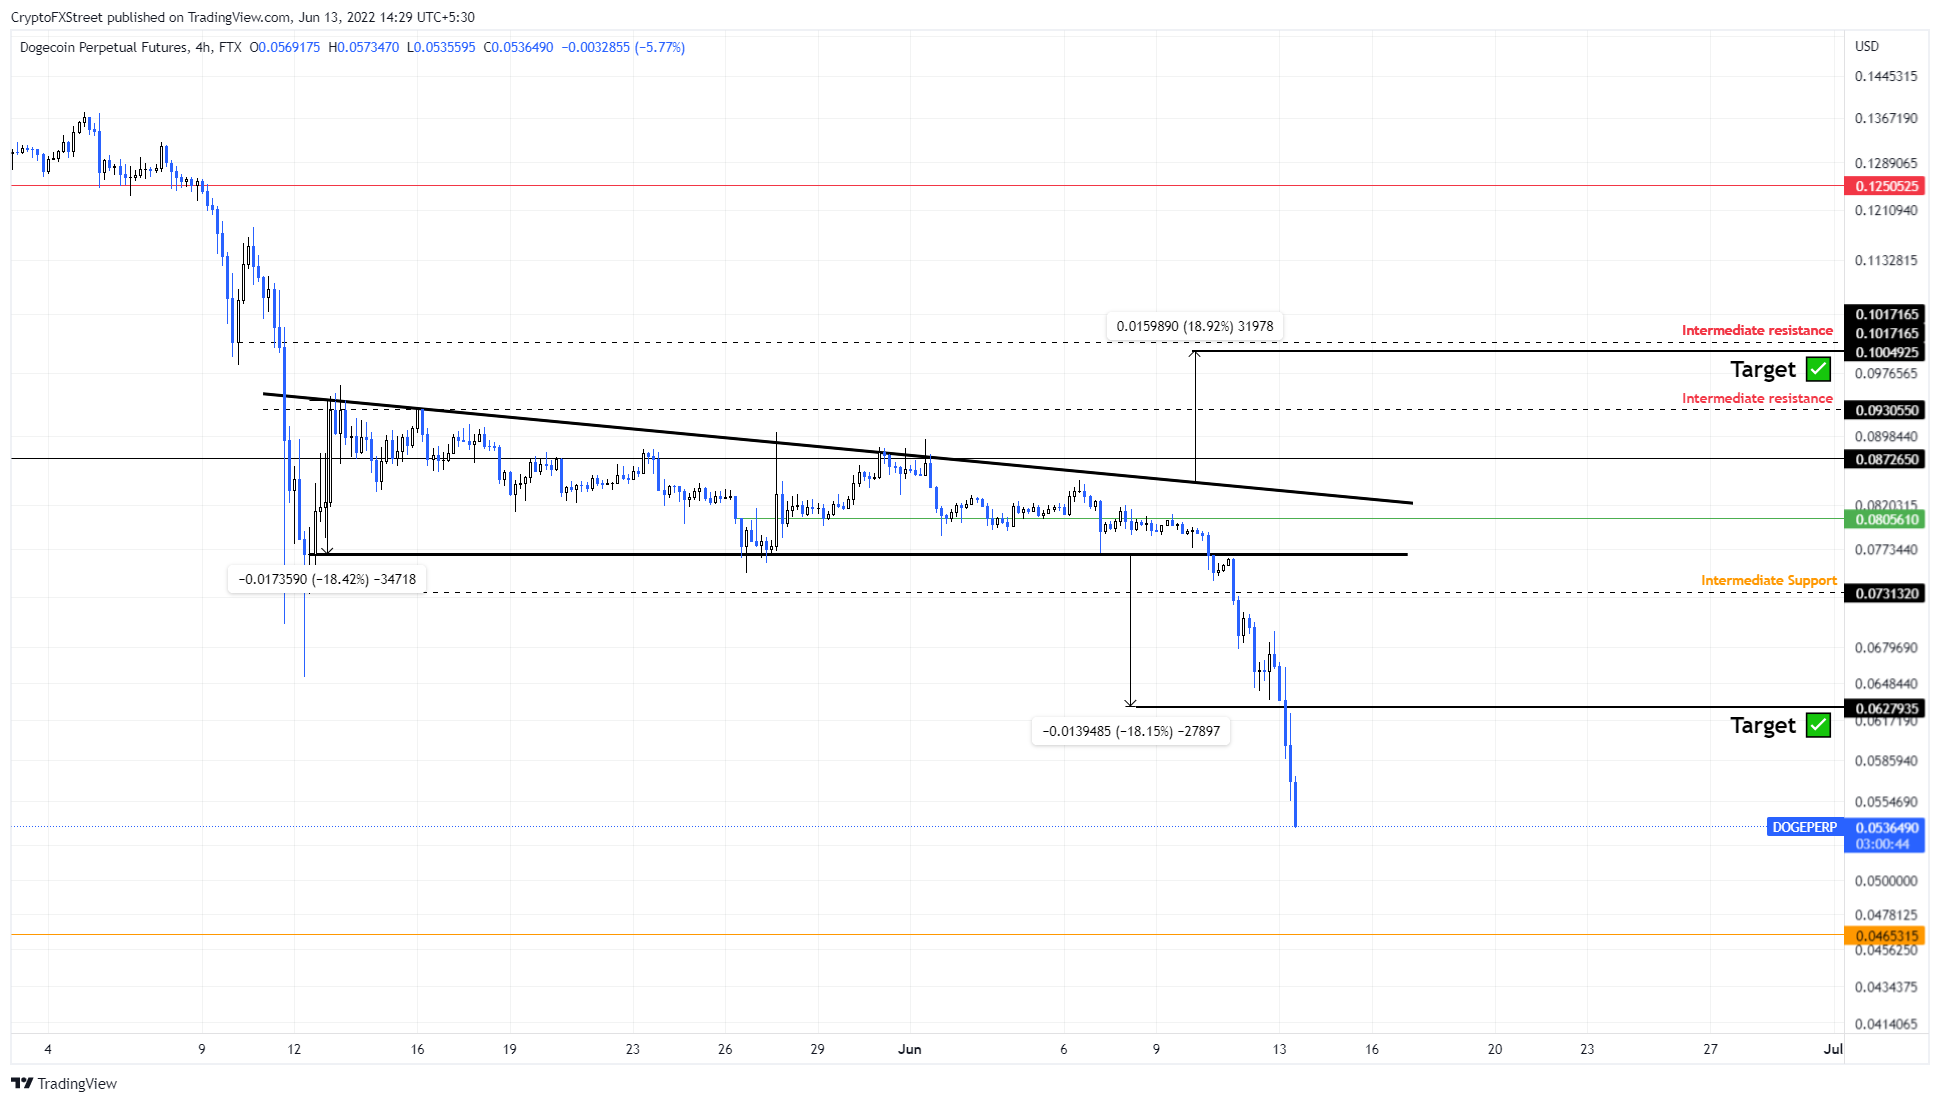
DOGE/USDT 4-hour chart
An interesting metric that supports the possibility of a descent into a stable support level is IntoTheBlock’s Historical Break Even Price. This metric is used to track the number of addresses with realized profits and losses and their variation over time.
Currently this indicator shows that 42% of all the investors that purchased DOGE since 2022 are ‘Out of the Money.’ Roughly 55% of the remaining are ‘In the Money,’ but are at the risk of being ‘At the Money’ or ‘Out of the Money’ if the Dogecoin price continues to drop.
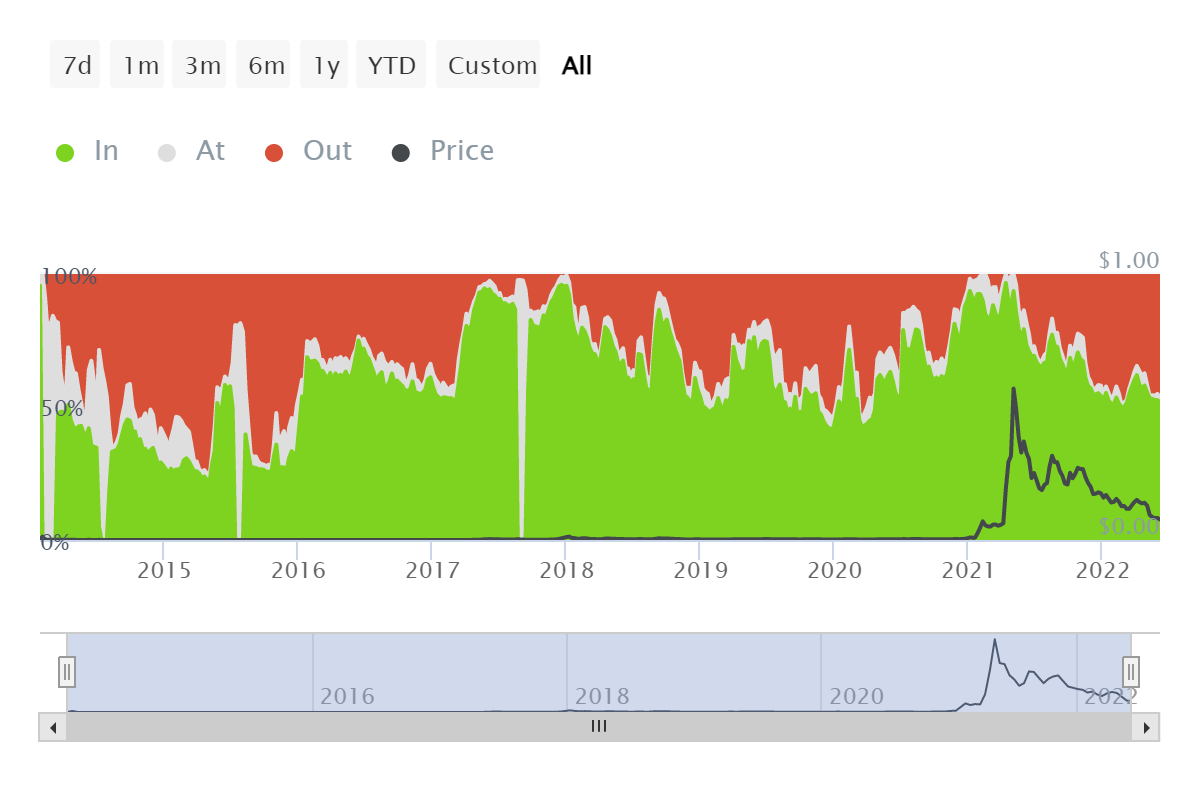
DOGE historical break even price chart
Since Dogecoin price has already hit the descending triangle’s forecasted target at $0.062, there is no invalidation thesis per se – the theory has already been proven correct. Hence, a recovery above $0.062 could see DOGE rally to $0.073 after a 16% climb.
Author

Akash Girimath
FXStreet
Akash Girimath is a Mechanical Engineer interested in the chaos of the financial markets. Trying to make sense of this convoluted yet fascinating space, he switched his engineering job to become a crypto reporter and analyst.



