Here’s why Ethereum Classic witnessed a massive rebound in its price with hashrate simulation
- Ethereum Classic’s hash rate bounced back with a spike in network activity and experts believe the altcoin is likely to climb higher.
- ETC registers a large price rally typically every few weeks, the last such spike was noted on January 4.
- The surge in the decentralized computing platform token meant that it outperformed large assets like Bitcoin and Ethereum.

Ethereum Classic, a decentralized, blockchain-based, open-source computing platform has witnessed a spike in its price. ETC has yielded double-digit gains for holders over the past 24 hours.
Ethereum Classic price rebounded massively, here’s why
Ethereum Classic (ETC), a blockchain based cryptocurrency that allows developers to build and deploy smart contracts, similar to the Ethereum network, recently witnessed a massive spike in its price.
The hash rate of the Ethereum Classic network declined throughout December 2022 and pivoted towards the end. While experts await a major recovery in ETC’s hashrate, a minor upside demonstrates a shift in miner activity.
The spike in hash rate indicates miner profitability and a significant surge in transactions.
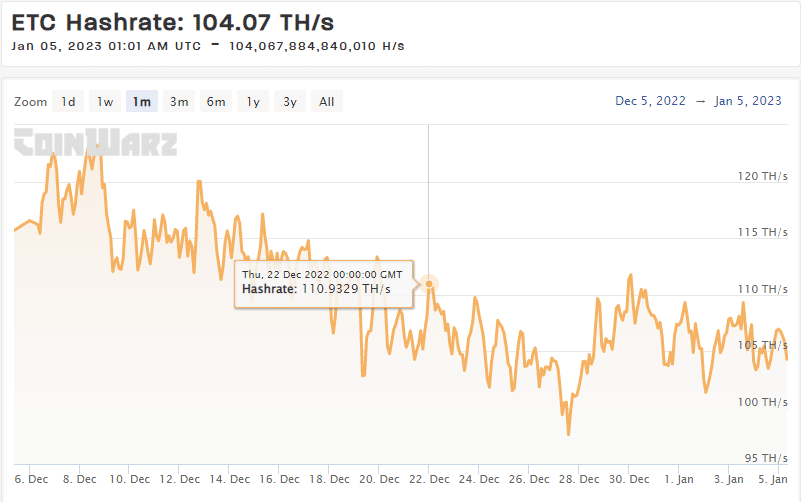
ETC hashrate
ETC transactions have increased in the last two days. The surge in volume hit a new monthly high and Ethereum Classic price yielded nearly 12% gains for holders overnight. The surge in volume was therefore accompanied by a massive uptick in ETC price.
ETC price climbed from $16.40 to $20.14 within the past two weeks. The price outlook on the token is bullish as the 50-day Exponential Moving Average (EMA) crossed above the 200-day EMA, in a golden cross. This signifies that the asset is ready to climb higher and is typically indicative of a bullish trend reversal.
With Relative Strength Index (RSI) at 73.65, ETC is in the overbought territory.
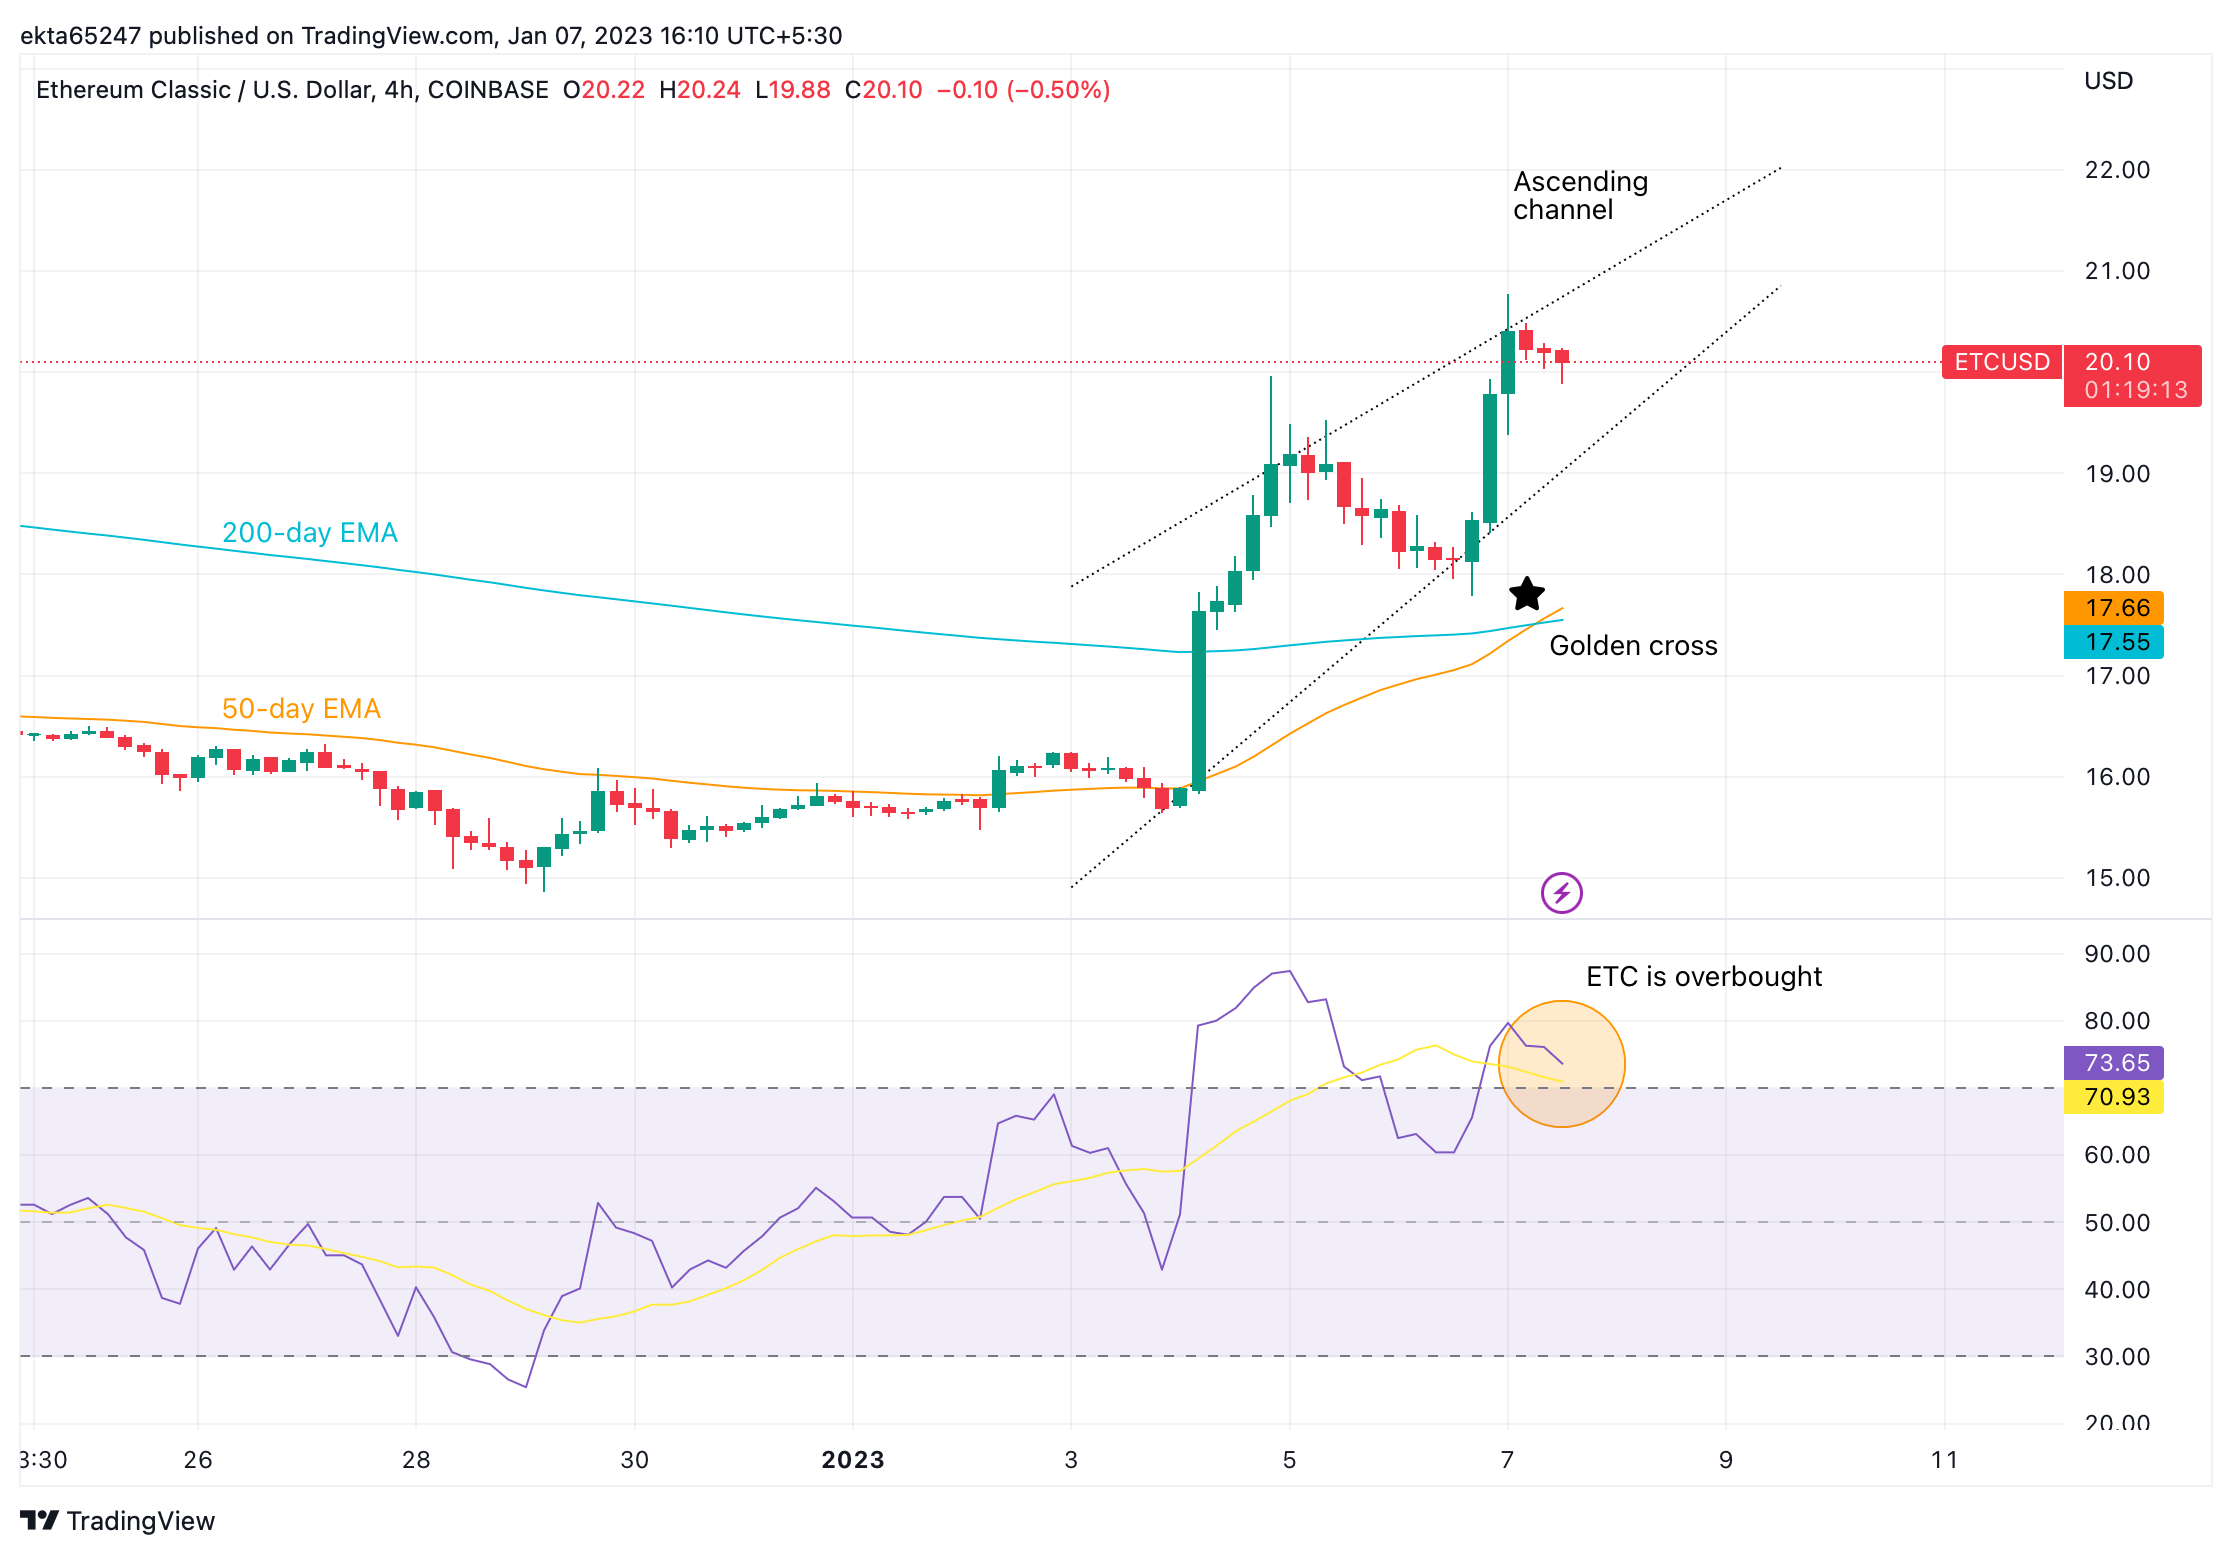
ETC/USD price chart
A drop below the lower trendline of the ascending channel could invalidate the bullish thesis for ETC price. A breakout above the upper trendline of the ascending channel in the chart above could push ETC price higher and support the bullish thesis in the decentralized smart contract platform token Ethereum Classic.
Author

Ekta Mourya
FXStreet
Ekta Mourya has extensive experience in fundamental and on-chain analysis, particularly focused on impact of macroeconomics and central bank policies on cryptocurrencies.




