Here’s why BNB is at risk of declining under $500 and Binance faces criticism on X
- Binance notes $2.8 billion in Bitcoin outflows, third largest exchange outflow this year, on Tuesday.
- The crypto exchange faces criticism for the alleged confiscation of Palestinian users’ funds.
- Binance denied reports and states that only a small number of accounts were restricted on account of illicit transactions.
Binance, one of the largest crypto exchanges by volume, has faced recent criticism on social media platforms like X. Crypto traders slammed the exchange for allegedly confiscating assets of Palestinian users.
The exchange denied the reports and offered an explanation for the restriction placed on certain user accounts, per a Cointelegraph report.
Crypto traders slam Binance for allegedly confiscating Palestinian users’ funds
Crypto Twitter is abuzz with the hashtag ‘Boycott Binance’ as traders urge others to withdraw funds from Binance. The exchange observed 2024’s fourth largest single-day outflow on Tuesday, August 27.
Recent allegations against @binance for freezing Palestinian assets have sparked a #BoycottBinance movement. While details are still emerging, the crypto community is reminded of the importance of decentralization. #CryptoRights #Decentralization https://t.co/XIfaSyUjL0
— RUDY $ARB (@dulponi) August 28, 2024
Nearly $2.8 billion in Bitcoin, over 45,000 BTC, left Binance on August 27 as users rallied against the exchange for restricting user funds and access for Palestinians. The exchange clarified its stance on the matter and denied the allegations.
In a Cointelegraph report, Binance said that the move to restrict was made on the grounds of illicit transaction activity in some accounts of users.
Binance told the firm that the restrictions placed by the exchange affected an “insignificant” number of users and said:
There have been some incorrect statements around this. Only a small number of user accounts, linked to illicit funds, were blocked from transacting.
The exchange did not share any details on the number of affected users or the timing of enforcing the restrictions.
BNB at risk of decline under $500
Binance Coin (BNB) is in an upward trend as seen in the BNB/USDT daily chart. The native token of the exchange could extend losses by nearly 6% and dip to support at $499, a key level for the asset.
BNB could sweep liquidity in the FVG between $497.70 to $498.70. The Moving Average Convergence Divergence (MACD), a momentum indicator, shows the MACD line is crossing under the signal line, meaning the underlying trend could turn negative.
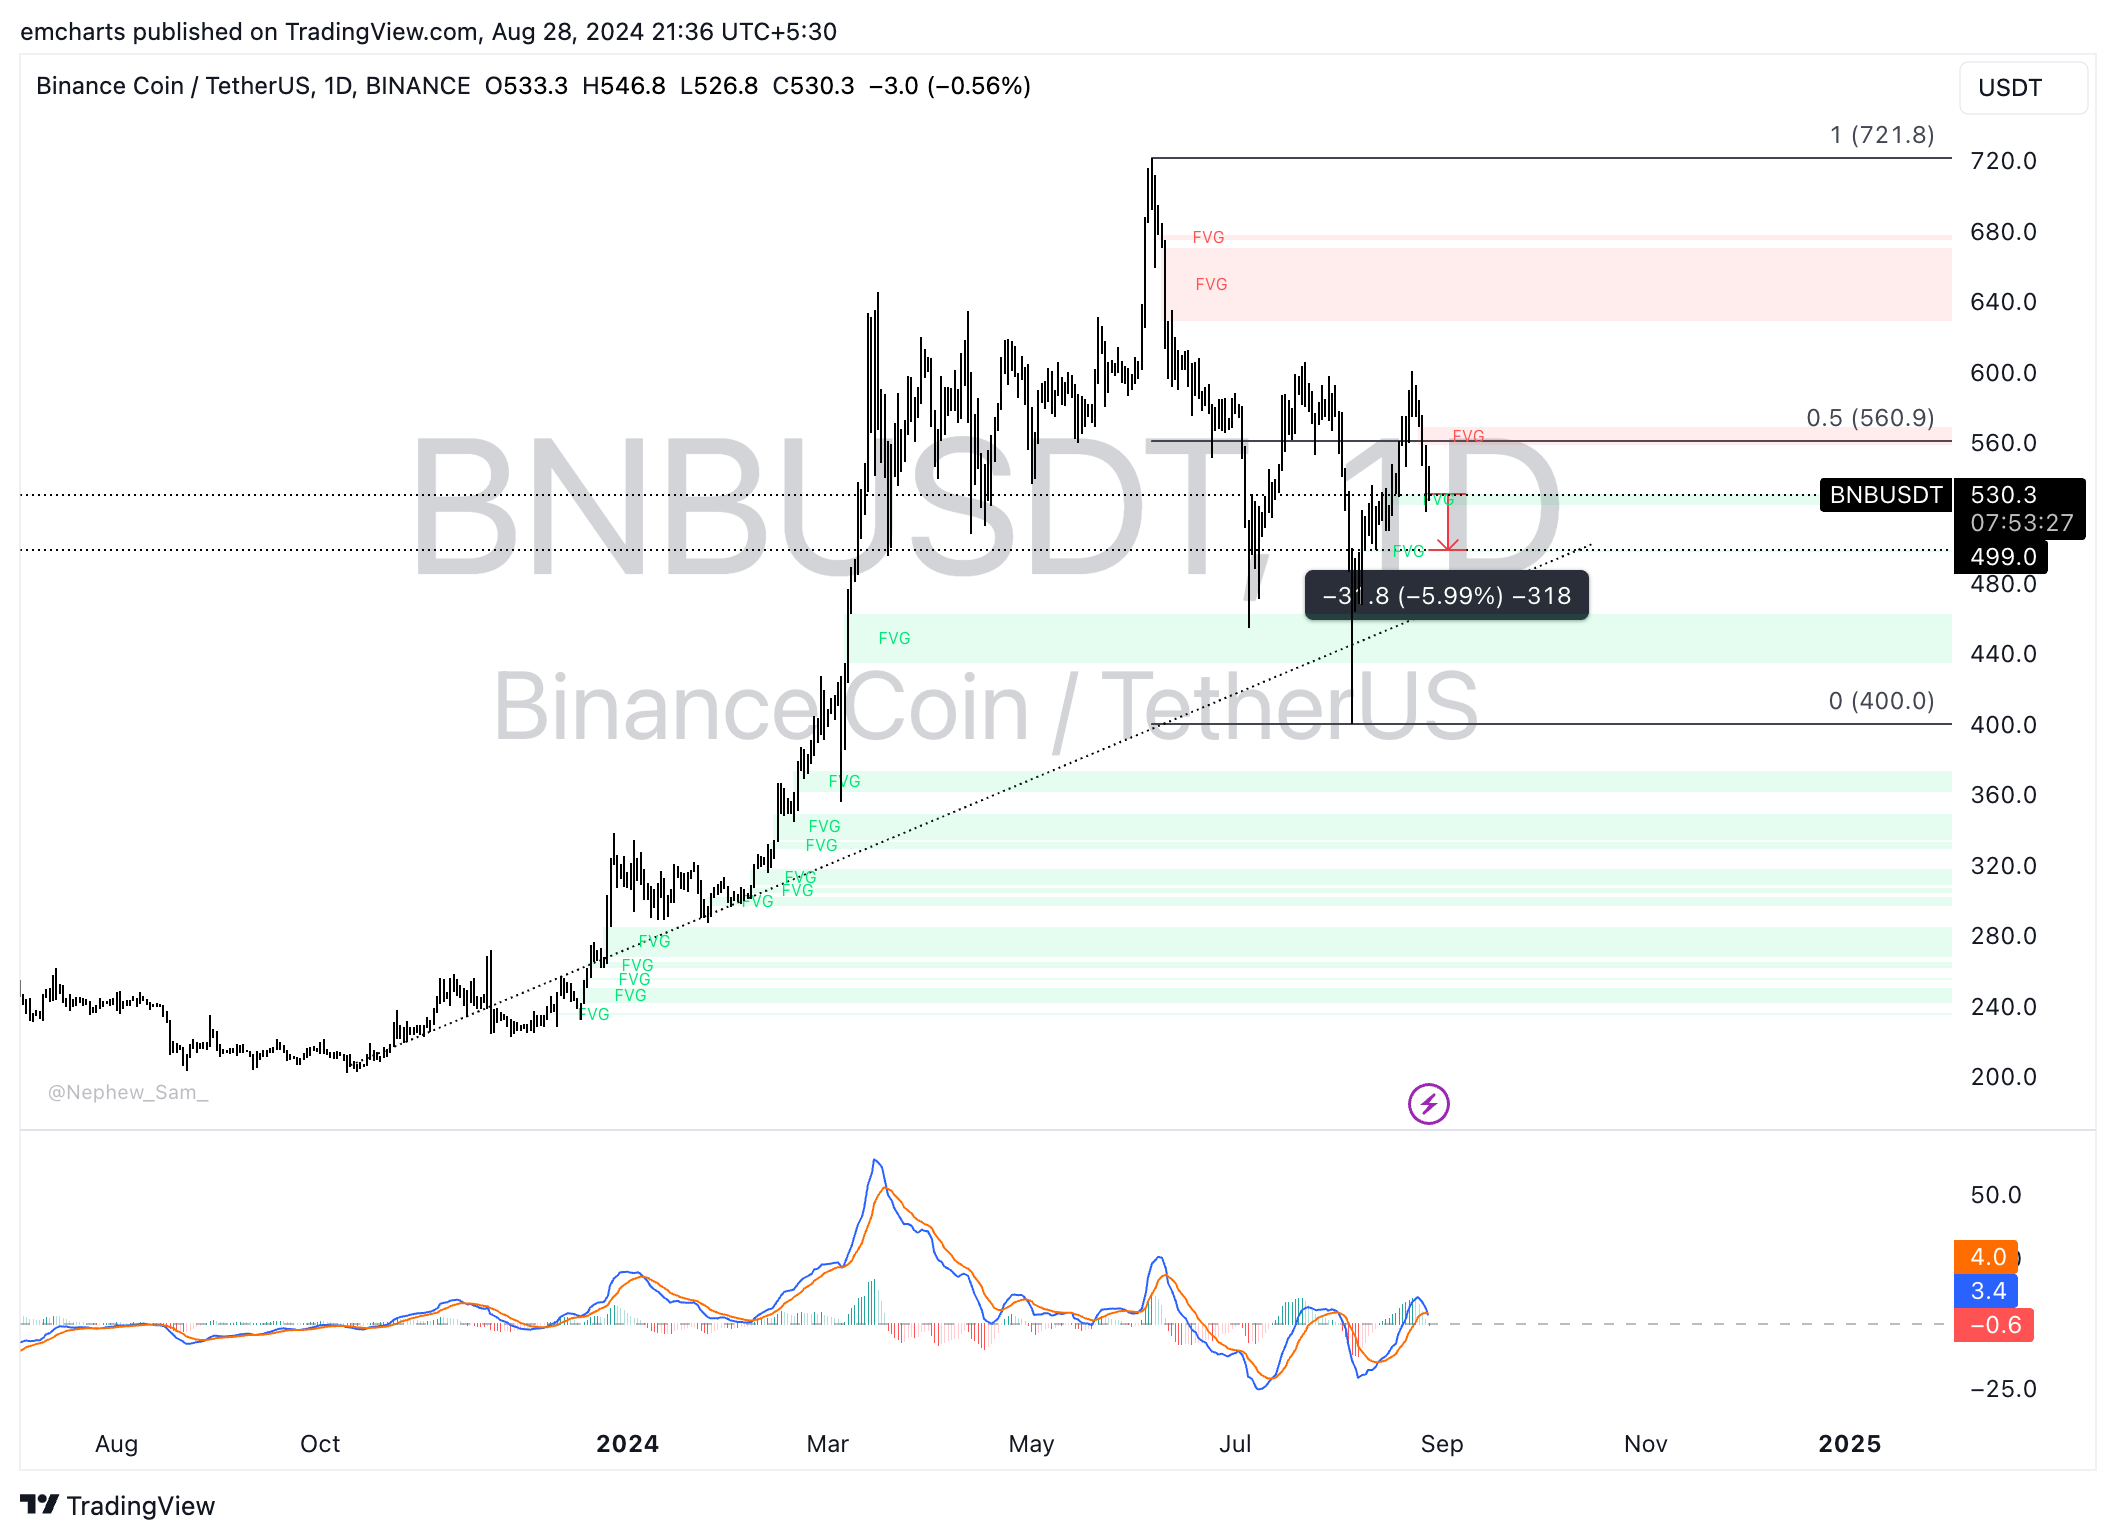
BNB/USDT daily chart
A daily candlestick close above $558 could invalidate the bearish thesis, and BNB could rally toward $560.90, the 50% Fibonacci retracement of the decline from the June 6 top of $721.80 to the August 5 low of $400.
Author

Ekta Mourya
FXStreet
Ekta Mourya has extensive experience in fundamental and on-chain analysis, particularly focused on impact of macroeconomics and central bank policies on cryptocurrencies.


