- Ripple price shows an ascending triangle formation spanning over the last two and a half months.
- This development could yield a conservative 7% to 15% upswing; a breakout could trigger a 25% ascent.
- A daily candlestick close below $0.318 will invalidate the bullish thesis and trigger a bearish breakout.
XRP price shows an ascending triangle formation, hinting at a bullish breakout. However, the altcoin is at a point where it could turn either way. Hence, investors must wait for double confirmation before jumping on this bullish trade.
Ripple price ready to make its move
XRP price has been producing higher lows and equal highs since June 10; connecting these swing points using trend lines results in an ascending triangle formation. This technical formation forecasts a 25% upswing, determined by adding the distance between the first swing high and swing low to the breakout point at $0.381.
Currently, XRP price is hovering around the bottom of the said pattern and has not given any discernable bullish hints except the ascending triangle formation. Therefore investors need to wait for a market structure shift, aka a flip of the $0.340 hurdle into a support floor.
This development will not only create a higher high and shift the market structure favoring the bulls, but it will also push buyers to start accumulating the remittance token. In such a case, investors can expect Ripple price to make a run for the immediate hurdle at $0.360.
Clearing this level will allow Ripple bulls to trigger a run-up to $0.381, which is an inflection point. A daily candlestick close above this barrier will reveal an ascending triangle breakout, which forecasts a 25% run-up to $0.477.
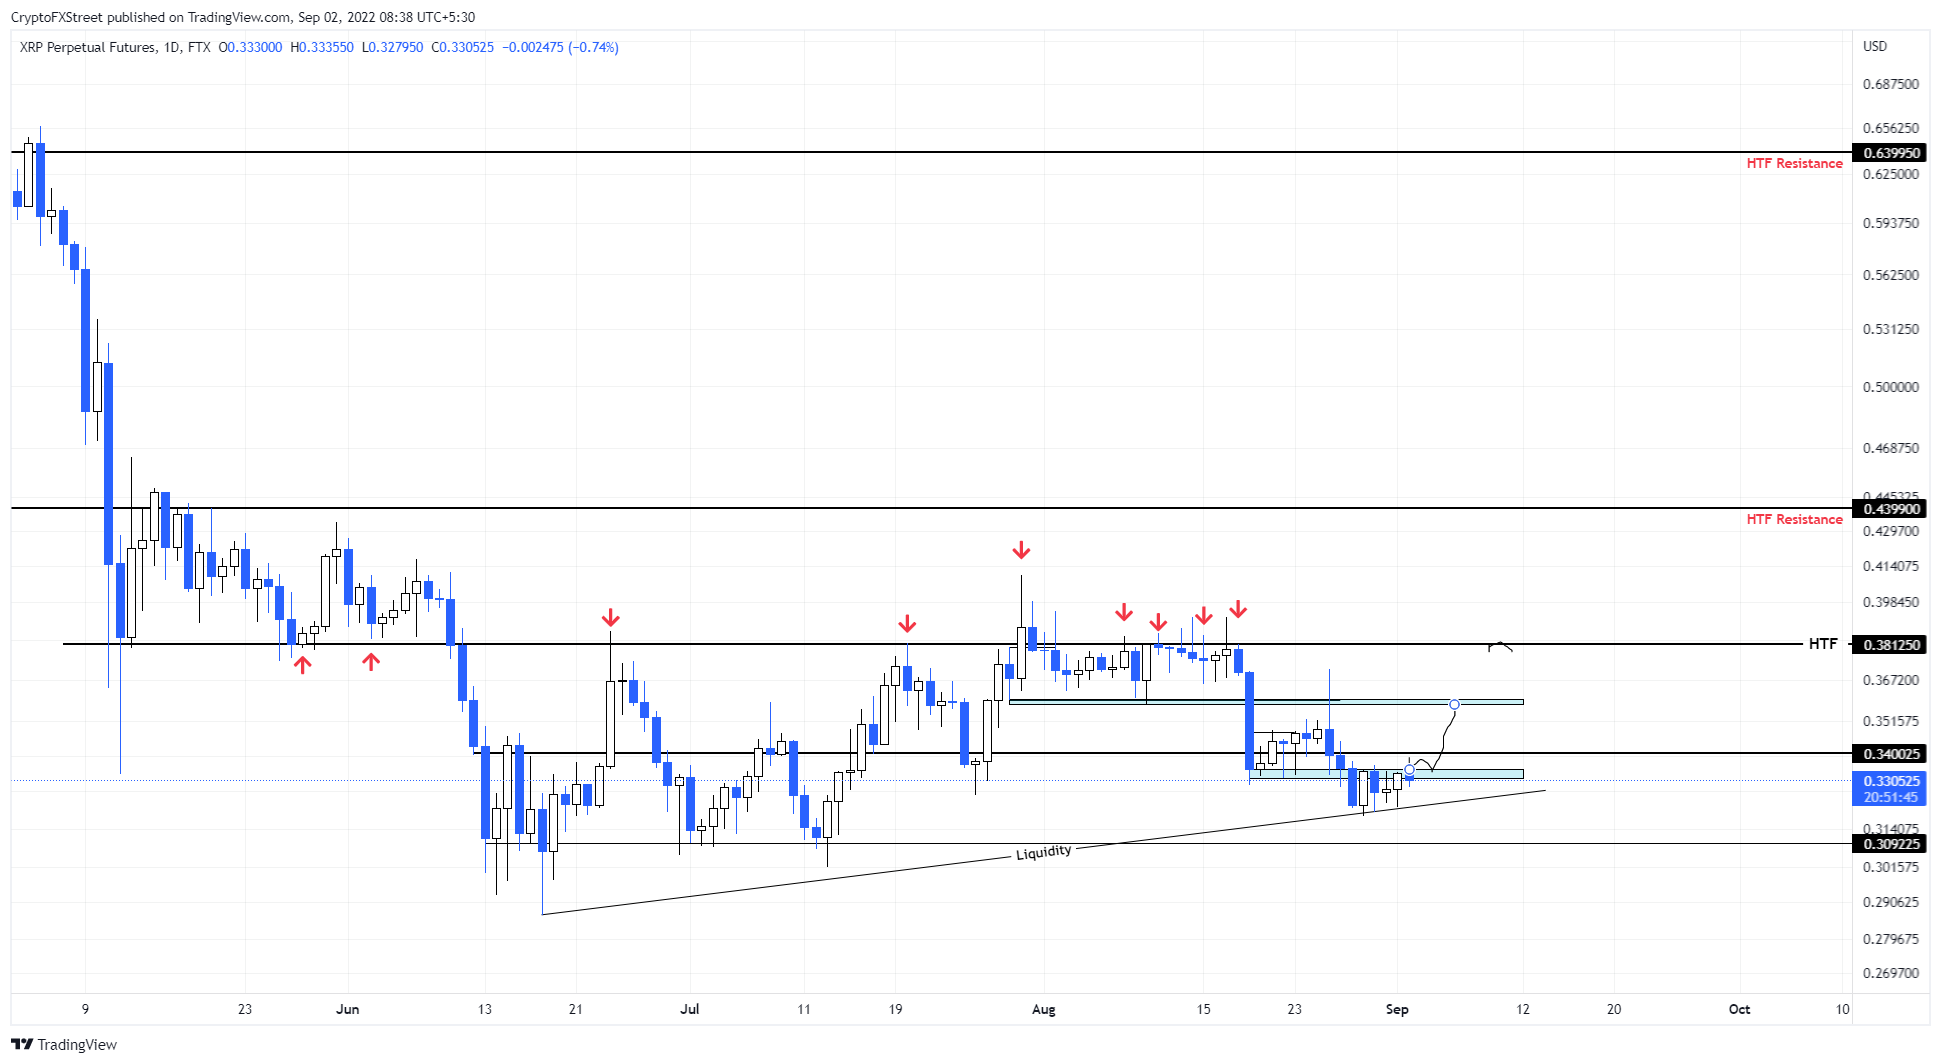
XRP/USDT 1-day chart
While the bullish outlook is logical and plausible, investors have no confirmation to start accumulating Ripple price at the current level of $0.332. Moreover, if Bitcoin price tumbles, there is a good chance the remittance token will follow.
In such a case, a daily candlestick close below $0.318 will create a lower low and invalidate the ascending triangle formation and potentially trigger a crash to $0.309, where buyers have a chance to come in and attempt recovery.
Information on these pages contains forward-looking statements that involve risks and uncertainties. Markets and instruments profiled on this page are for informational purposes only and should not in any way come across as a recommendation to buy or sell in these assets. You should do your own thorough research before making any investment decisions. FXStreet does not in any way guarantee that this information is free from mistakes, errors, or material misstatements. It also does not guarantee that this information is of a timely nature. Investing in Open Markets involves a great deal of risk, including the loss of all or a portion of your investment, as well as emotional distress. All risks, losses and costs associated with investing, including total loss of principal, are your responsibility. The views and opinions expressed in this article are those of the authors and do not necessarily reflect the official policy or position of FXStreet nor its advertisers. The author will not be held responsible for information that is found at the end of links posted on this page.
If not otherwise explicitly mentioned in the body of the article, at the time of writing, the author has no position in any stock mentioned in this article and no business relationship with any company mentioned. The author has not received compensation for writing this article, other than from FXStreet.
FXStreet and the author do not provide personalized recommendations. The author makes no representations as to the accuracy, completeness, or suitability of this information. FXStreet and the author will not be liable for any errors, omissions or any losses, injuries or damages arising from this information and its display or use. Errors and omissions excepted.
The author and FXStreet are not registered investment advisors and nothing in this article is intended to be investment advice.
Recommended Content
Editors’ Picks
Cardano Price Forecast: ADA's recent breakout could trigger 15% rally

Cardano price rally on Monday suggests that a larger bullish move might be in the works. On-chain data shows a comeback in investor interest and entry of institutional investors.
Ondo price poised to break ATH of $1.04

Ondo price is slowly testing its major support level at $0.63-$0.61. Aggressive buyers can consider accumulating around the immediate support zone, which extends from $0.83 to $0.80.
Shiba Inu price flashes buy signal, 25% rally likely Premium
Shiba Inu price has flipped bullish to the tune of the crypto market and breached key hurdles, showing signs of a potential rally. Investors looking to accumulate SHIB have a good opportunity to do so before the meme coin shoots up.
New York Attorney General reaches $2 billion settlement with Genesis after claims of fraud

New York Attorney General Letitia James says her office has secured a $2 billion settlement from Genesis. AG Letitia James sued the crypto company in October on account of lying and defrauding investors of over $1 billion.
Bitcoin: Is BTC out of the woods? Premium

Bitcoin price shows signs of continuing its uptrend, providing a buying opportunity between $64,580 to $63,095. On-chain metrics forecast a bullish outlook for BTC ahead. If BTC clears $70,000, the chances of resuming the uptrend would skyrocket.