- dYdX whales holding between 100,000 to 1 million tokens have consistently accumulated the token since March.
- The accumulation of dYdX by whales has reduced token reserves across exchanges, resulting in a decline in selling pressure.
- Experts are bullish on dYdX price rally in the short term and believe the token could sustain its recent gains.
dYdX token’s large wallet investors have steadily accumulated the asset since March 2023. Whale accumulation coupled with a declining supply on exchanges is considered a bullish sign for the token, and experts predict a sustained uptrend in dYdX.
Also read: Ethereum and altcoins gear up for alt season with this move in Bitcoin dominance
On-chain metrics supporting bullish thesis for dYdX
Whale wallet holdings and exchange reserves of dYdX are the two on-chain metrics that support a bullish view of the token. Large wallet investors holding between 100,000 to 1 million dYdX tokens have consistently scooped up the asset since March. This segment of whales now holds nearly 5.6% supply based on data from crypto intelligence tracker Santiment.
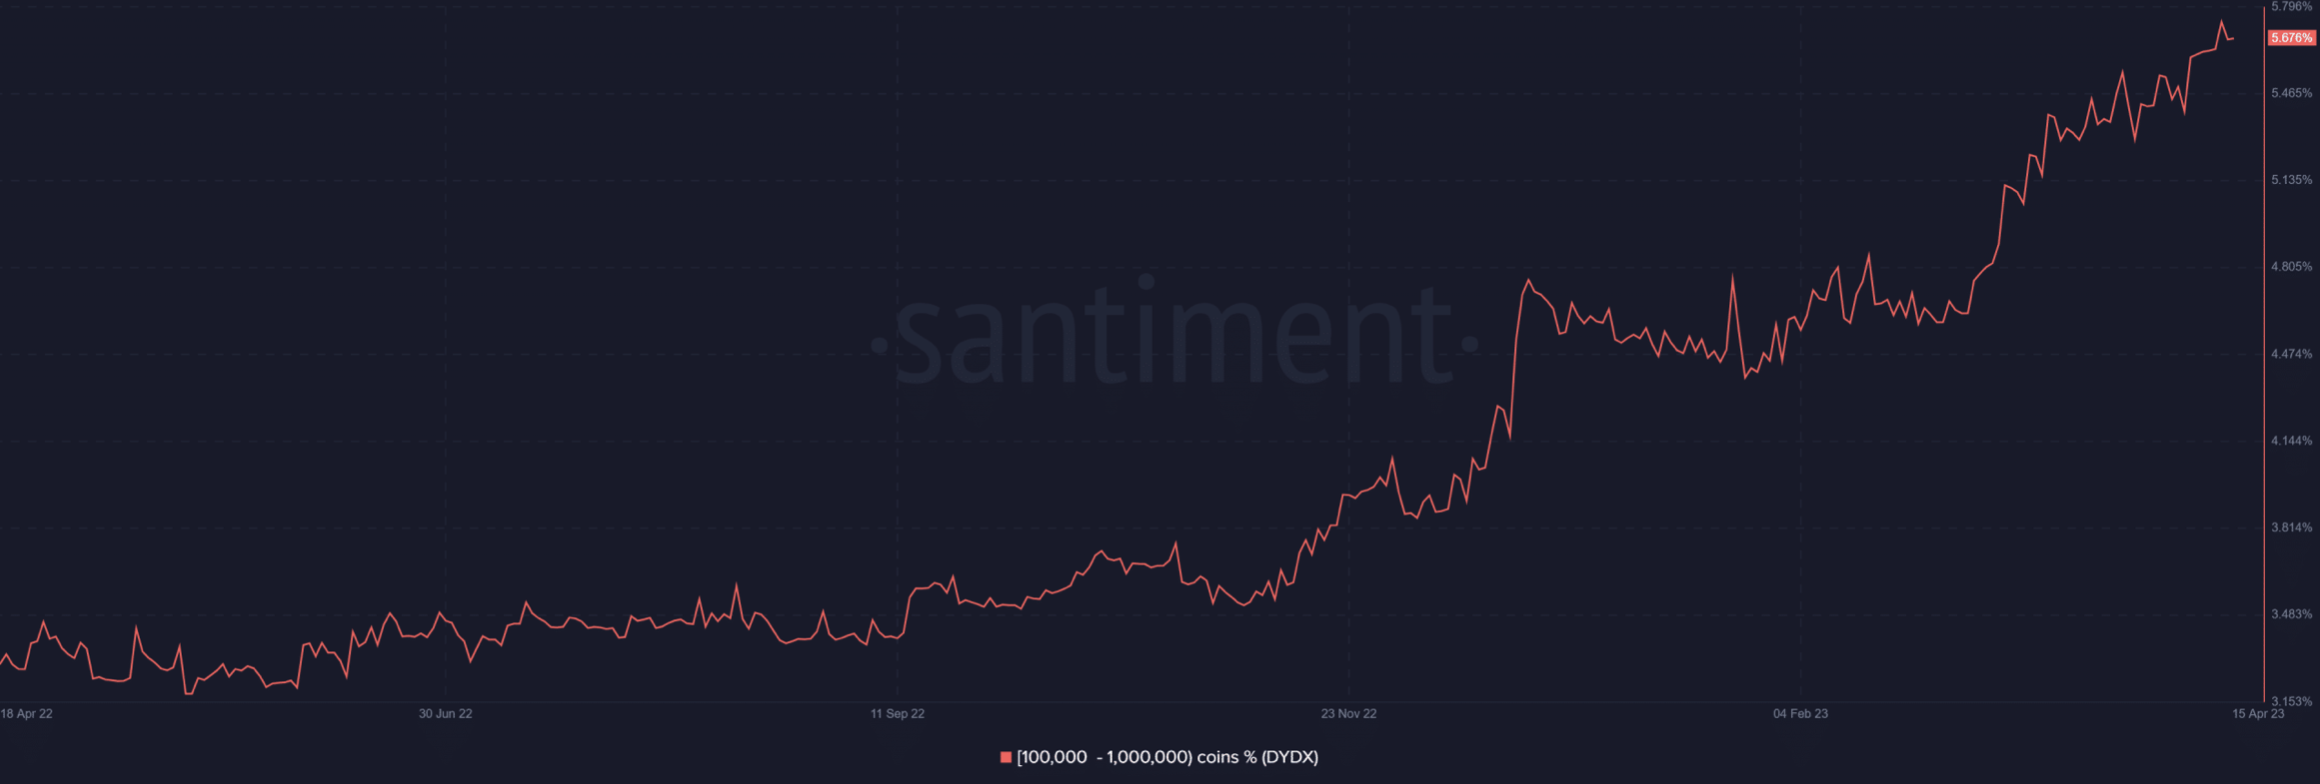
dYdX accumulation by whales
Whale accumulation is a typical bullish sign for an asset; when coupled with declining exchange reserves, it supports the thesis of a sustained price rally in dYdX. Declining exchange reserves reduce the selling pressure on an asset in the long term.
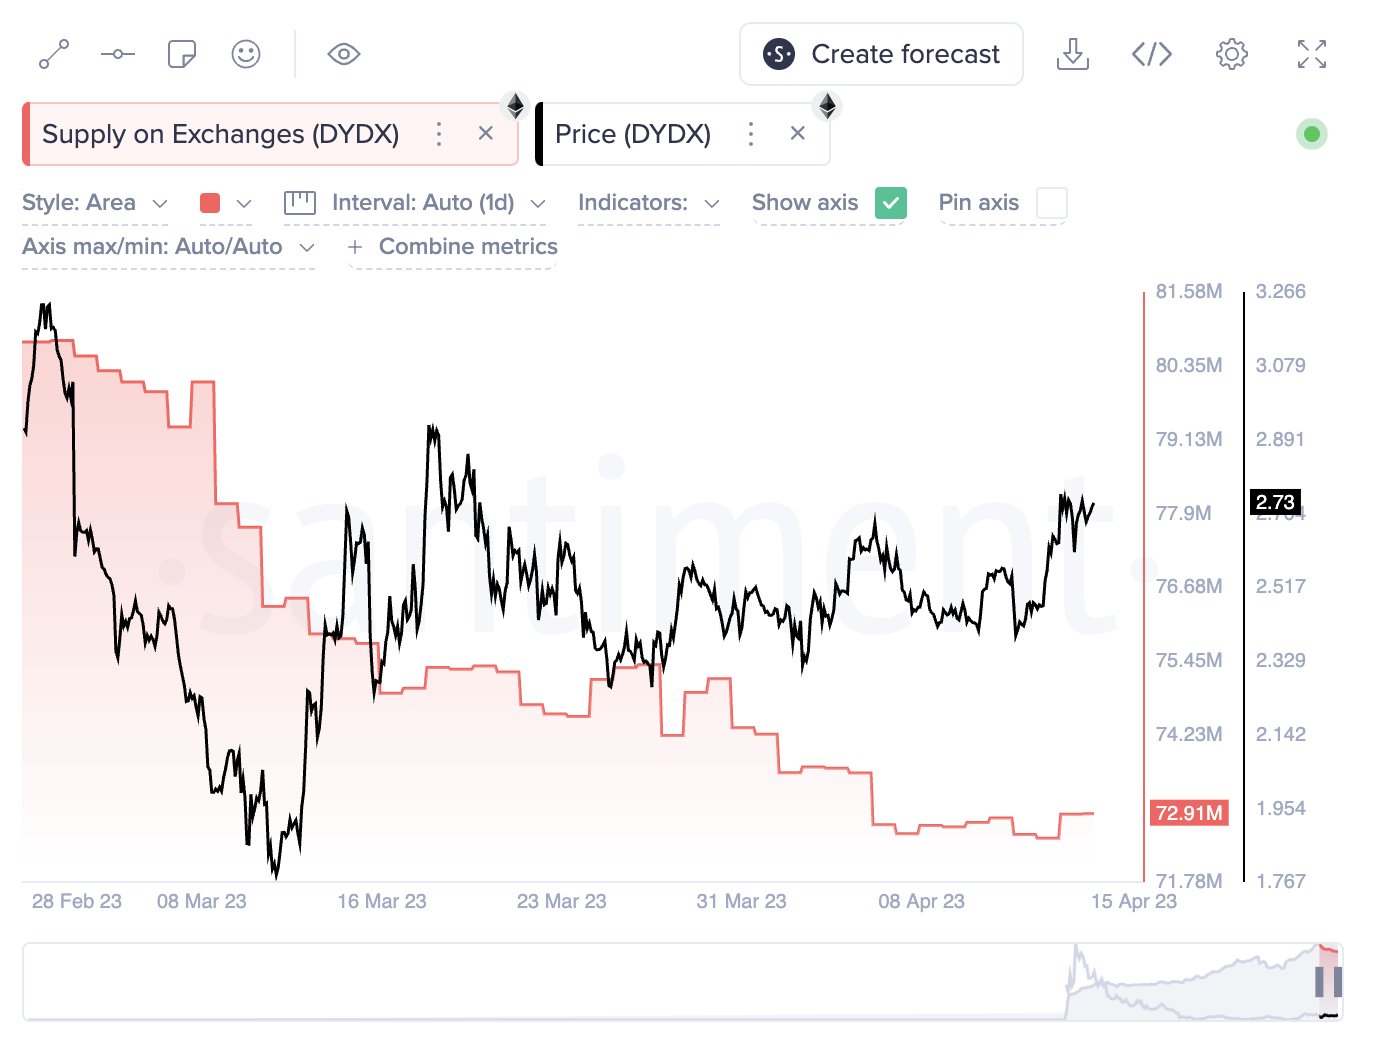
Supply of dYdX on exchanges
dYdX exchange supply declined by over 10 million between February and April 2023, easing the selling pressure on the asset. Around 7.86 million tokens have been withdrawn in the last three weeks.
Experts predict a sustained uptrend in dYdX
Technical experts noted that the dYdX price recently broke out of its downtrend, represented by the red band below. Before its breakout, the token consolidated within a band for months between May 2022 and February 2023.
dYdX price move in the green band is a bullish sign for the asset, and Jackis, a technical expert and trader, has set a target of March 2022 highs above $6 for dYdX.
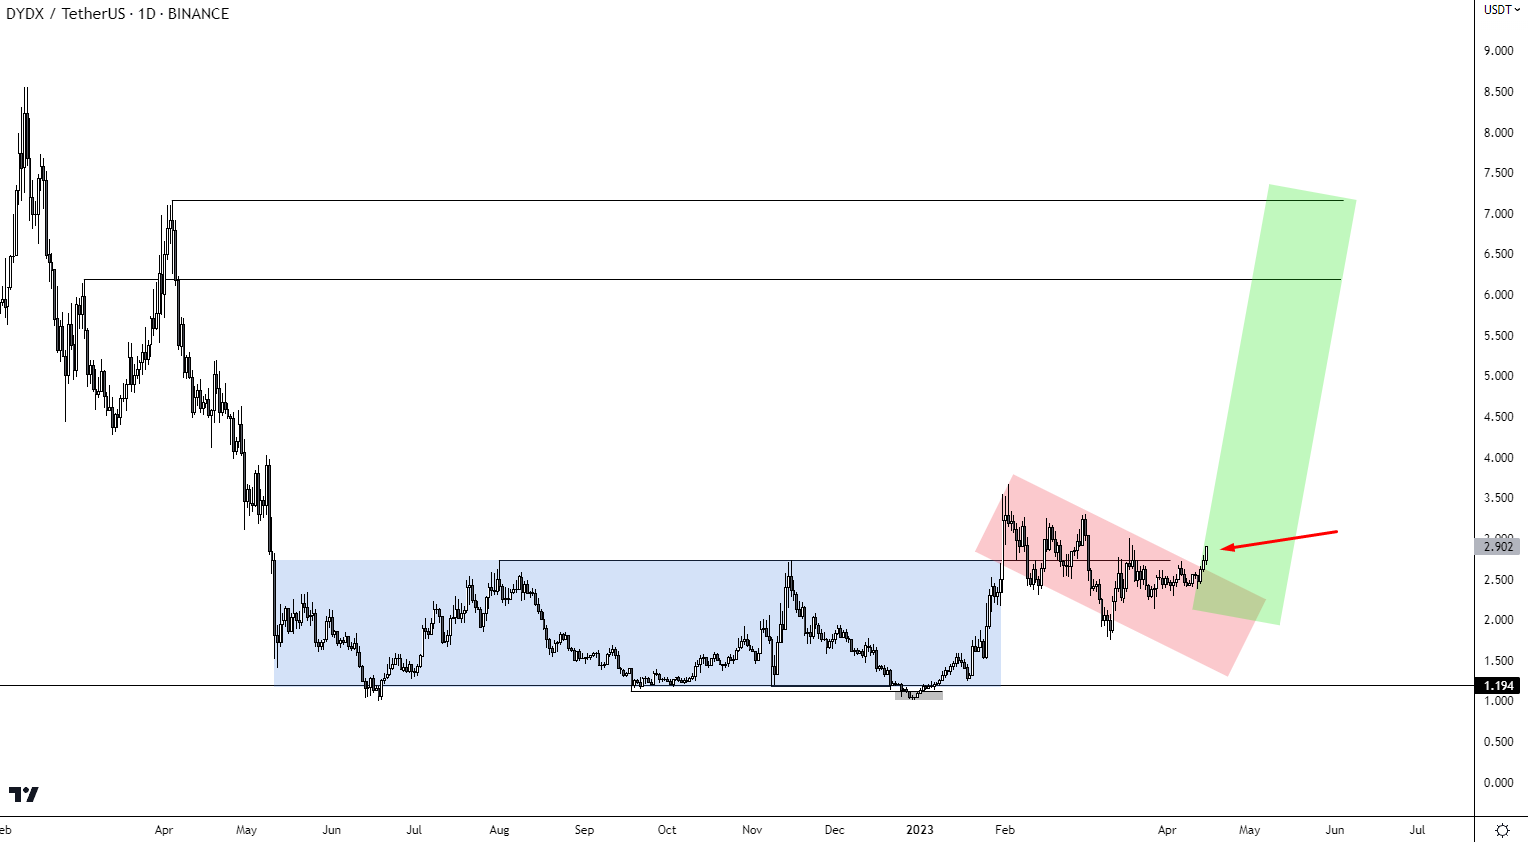
dYdX/USDT 1D price chart
A decline below support at $2.5 could invalidate the bullish thesis for the token and result in consolidation within the blue band between $1.19 and $2.5.
Information on these pages contains forward-looking statements that involve risks and uncertainties. Markets and instruments profiled on this page are for informational purposes only and should not in any way come across as a recommendation to buy or sell in these assets. You should do your own thorough research before making any investment decisions. FXStreet does not in any way guarantee that this information is free from mistakes, errors, or material misstatements. It also does not guarantee that this information is of a timely nature. Investing in Open Markets involves a great deal of risk, including the loss of all or a portion of your investment, as well as emotional distress. All risks, losses and costs associated with investing, including total loss of principal, are your responsibility. The views and opinions expressed in this article are those of the authors and do not necessarily reflect the official policy or position of FXStreet nor its advertisers. The author will not be held responsible for information that is found at the end of links posted on this page.
If not otherwise explicitly mentioned in the body of the article, at the time of writing, the author has no position in any stock mentioned in this article and no business relationship with any company mentioned. The author has not received compensation for writing this article, other than from FXStreet.
FXStreet and the author do not provide personalized recommendations. The author makes no representations as to the accuracy, completeness, or suitability of this information. FXStreet and the author will not be liable for any errors, omissions or any losses, injuries or damages arising from this information and its display or use. Errors and omissions excepted.
The author and FXStreet are not registered investment advisors and nothing in this article is intended to be investment advice.
Recommended Content
Editors’ Picks
VeChain Price Prediction: VET bears eye 10% correction

VeChain price is slowly undoing the gains witnessed in the second and third weeks of September. If this trend continues, VET could stand to trigger a steep correction in the near future.
Bitcoin Cash Price Forecast: BCH traders can bank on short-term bounce to $228

Bitcoin Cash (BCH) price presents an opportunity that could profit traders who are bullish on the short term. Additionally, investors might get a better chance to accumulate due to a pullback to a key support level.
Shiba Inu inspired meme coin BONE notes first rise following the 55% crash in two months

Bone ShibaSwap price, at the time of writing, was just above $0.82, marking the first green candle since the beginning of August. Selling pressure concerning BONE is rather intense in the market, however, no major dump has been observed.
Binance reopens Belgium operations after three months of suspension by FSMA

Binance Exchange has reopened registrations for its Belgian community to access its products and services. The restoration comes with new “Terms of Use”, as the platform looks to steer clear of regulatory mishaps.
Bitcoin: BTC downside likely after 20-week EMA culls bulls

Bitcoin (BTC) bearish price fractal, as discussed in a previous article, is underway, but the lack of volatility is causing ambiguity and doubt. Regardless, BTC might see a bit of an upside before the long-term bearish scenario plays out.