Here is why Cardano price might dip to $2 before new all-time highs
- Cardano price has set up a bearish divergence on a weekly time frame, hinting at a crash.
- Transactional data shows ADA bulls are losing the fight to reclaim the $2.79 resistance level.
- Despite a new all-time high, the number of new addresses has remained the same over the past six months.

Cardano price has been on an explosive run, but lately things have calmed down as it hovers below a crucial resistance level. While investors are waiting with bated breath for a new all-time high, the technicals and on-chain metrics indicate that a downswing seems likely for ADA.
Cardano price prepares for a sub-$2 move
Cardano price has been on a 1,844% upswing since the beginning of 2021 and looks unbeatable considering its recent explosive growth. While that may be true, it is not the complete picture.
The weekly chart shows that ADA set up two swing points on May 10 and August 23. These higher highs might look bullish to the naked eye, but when viewed together with a momentum indicator such as the Relative Strength Index (RSI) it shows an entirely different outlook.
The RSI has established lower lows on May 10 and August 23 relative to the Cardano price action, creating what is known as a bearish divergence. This technical pattern typically results in a momentary downswing for ADA price.
An example of the bearish divergence can be seen on the same weekly chart when comparing the swing points set up on February 22 and May 10 between the Cardano price and the RSI. What followed next was a 59% downswing that lasted a week.
While it is uncertain if the anticipated sell-off will be that grim, one can expect a downswing to extinguish around $2.30. In a bearish case, it could head to the $1.77 support barrier.
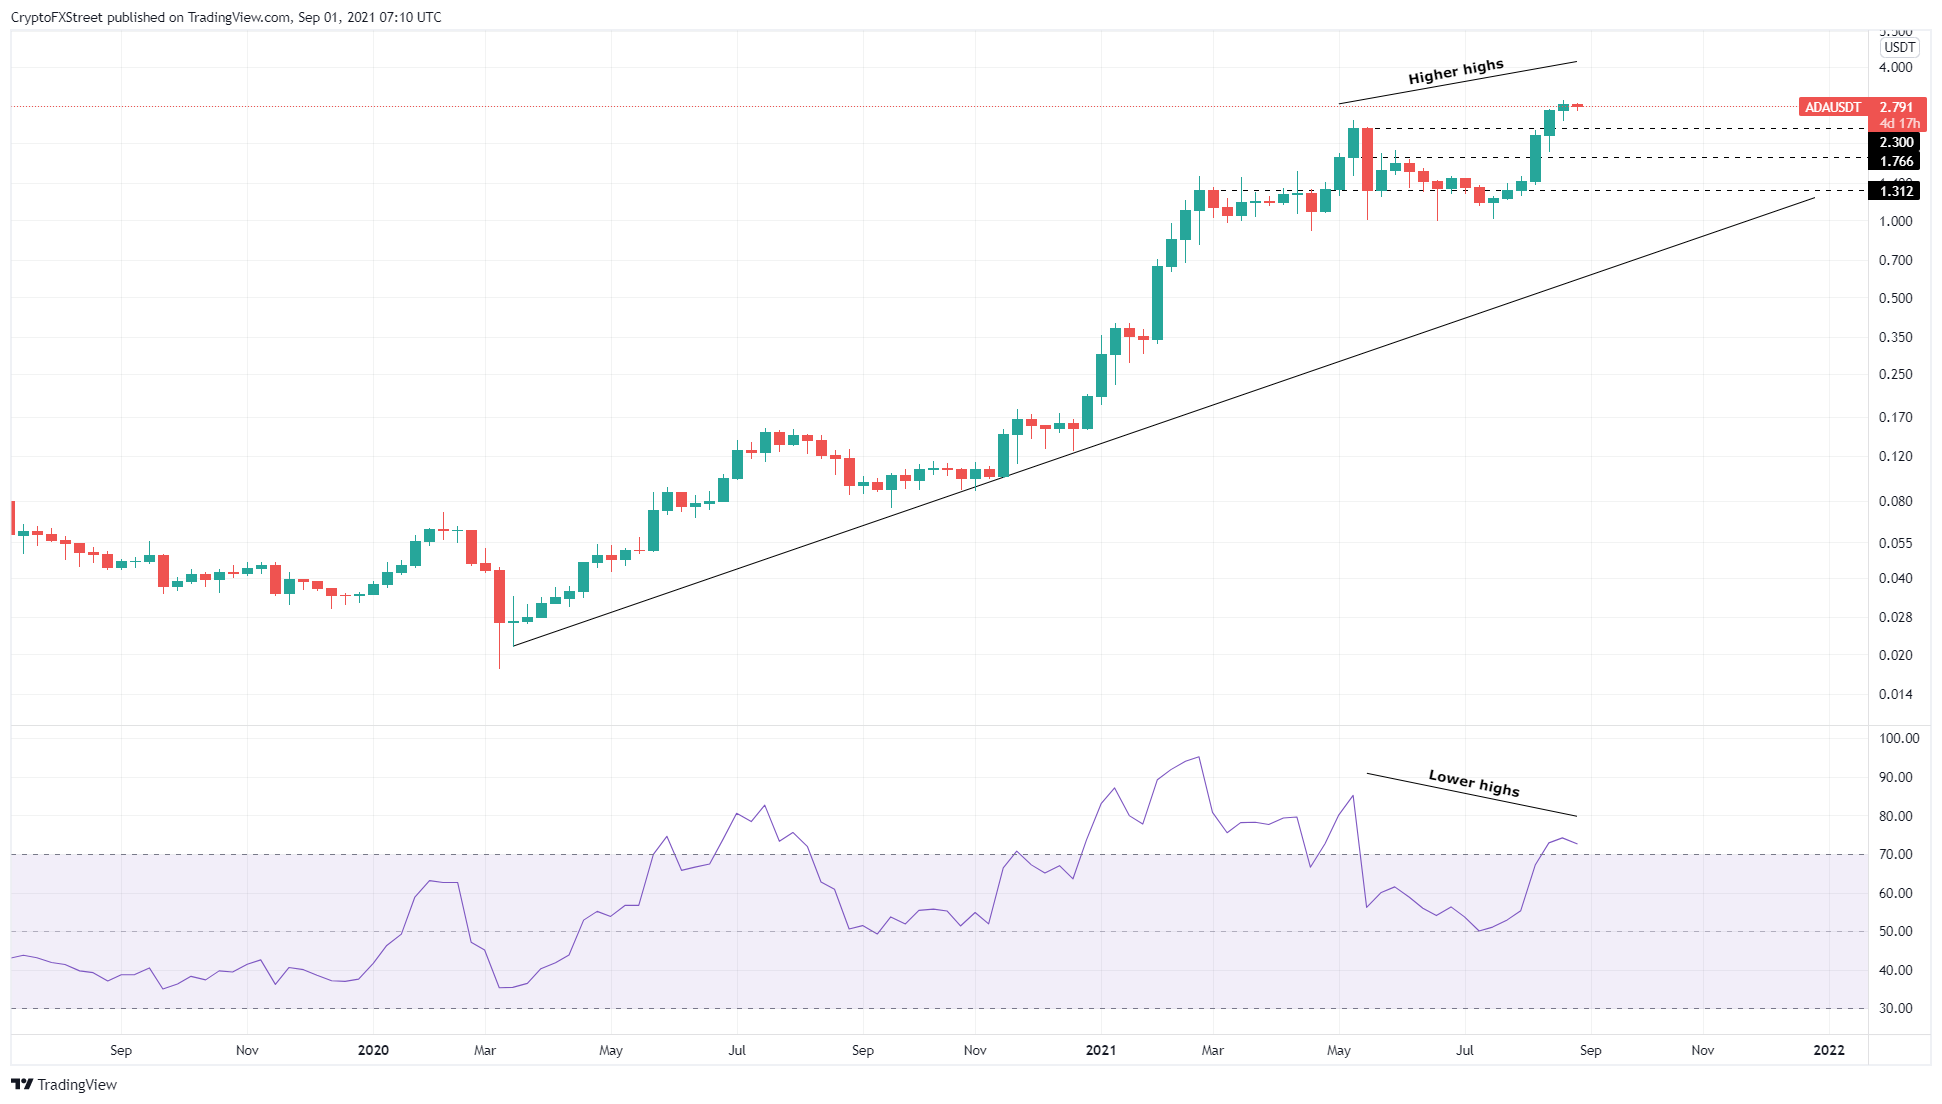
ADA/USDT 1-week chart
Supporting this downswing is IntoTheBlock’s Global In/Out of the Money (GIOM) model, which shows ADA might push a massive cluster of investors into underwater territory.
Adding credence to the pessimistic thesis is IntoTheBlock’s Global In/Out of the Money (GIOM) model, which shows ADA might push a massive cluster of investors into underwater territory.
Roughly 240,000 addresses that purchased 6.3 billion ADA will see their holdings go “Out of the Money” if Cardano price produces a daily close below $2.79.
This could trigger investors to sell their tokens to break even, catalyzing a crash, as explained above.
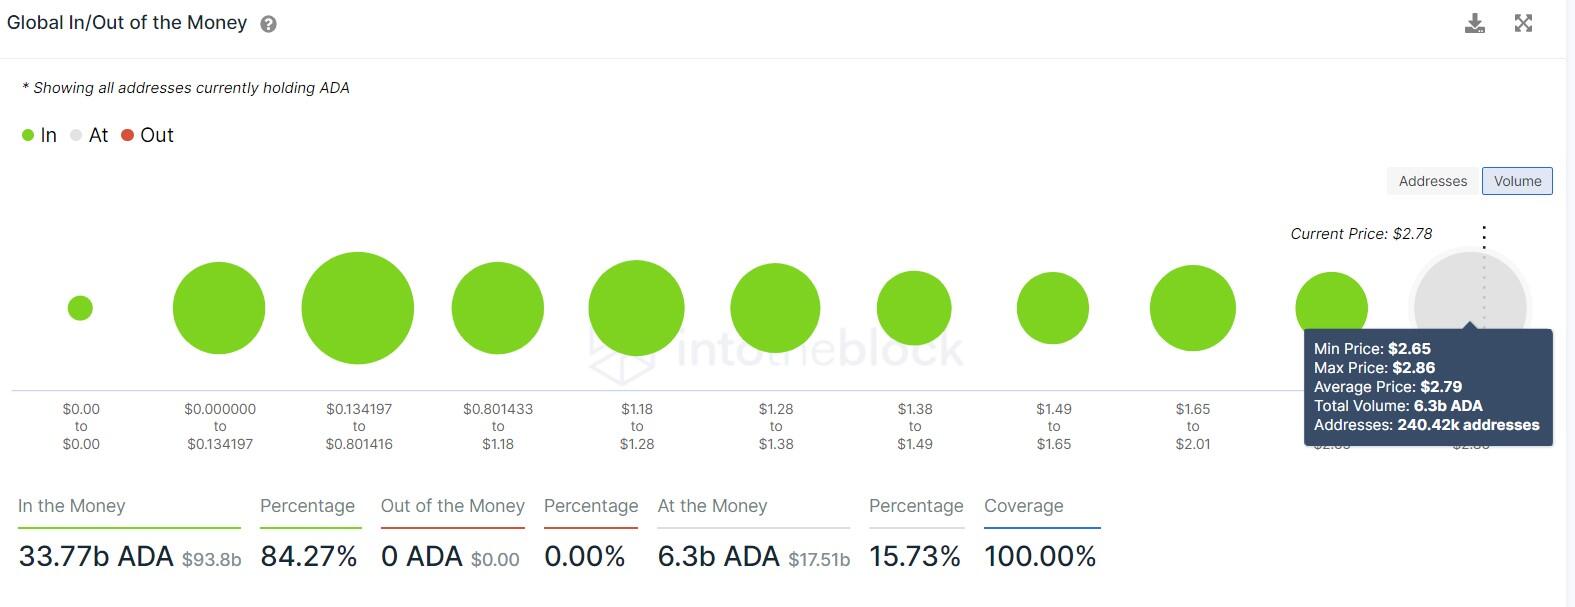
ADA GIOM chart
Interestingly, Cardano price’s new all-time high does not seem to be attracting new investors, which is seen in the daily new addresses metric. This on-chain index shows that the new users joining the network have decreased from 58,500 to 55,800 over the past six months.
The 4.6% decline indicates that market participants are uninterested in ADA despite its exponential growth, or perhaps investors are not sold on the idea that the 2021 bull run has restarted.
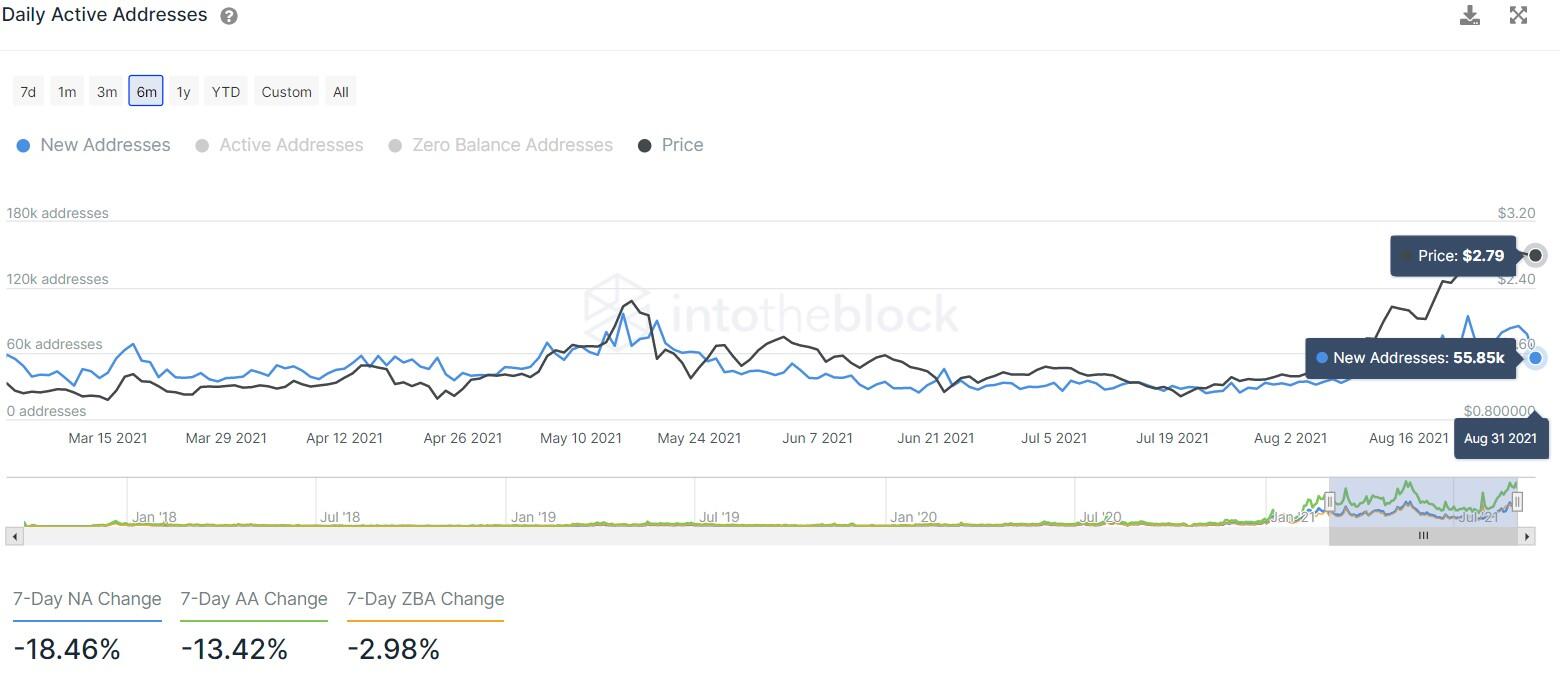
ADA new addresses chart
Lastly, the investors’ sentiment seen in the daily new address metric is further echoed by the social volume index, which shows a series of lower highs since late August. Furthermore, the on-chain volume is also showing multiple lower highs, while the price has created higher highs, signifying yet another bearish divergence for Cardano price.
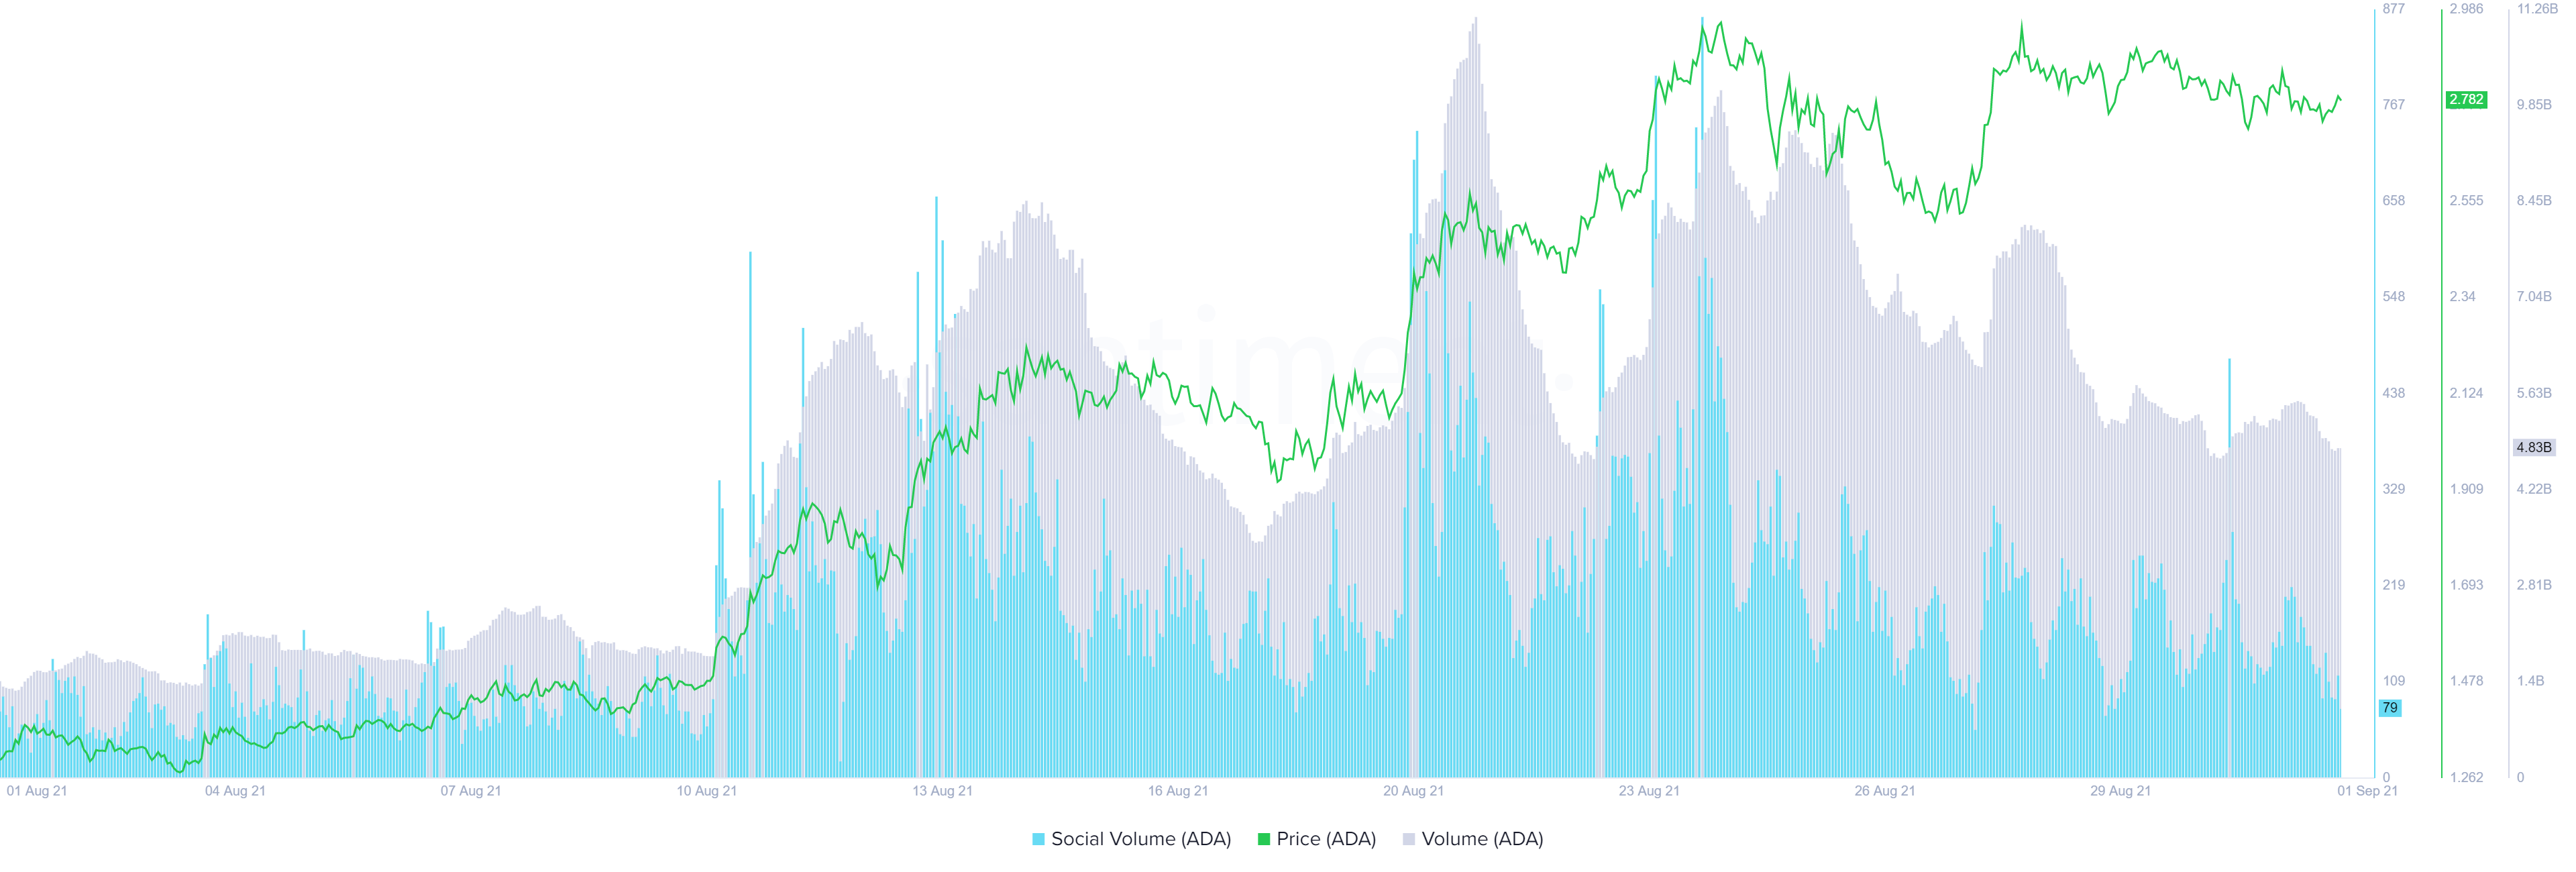
ADA on-chain volume, social volume chart
To add to its woes, the recent announcement of the Alonzo hard fork, which sparked a bull run for ADA, seems to be doing nothing even as the InputOutput HK developers announced that smart contact capabilities would be tested on the Cardano testnet on September 2.
Tomorrow around UTC 20:20, the #Cardano Public Testnet will hardfork into the #Alonzo era, adding #Plutus #smartcontracts capability. The start of the countdown to full mainnet deployment & the beginning of an exciting new era for Cardano. Here’s what to expect: @Cardano $ADA pic.twitter.com/6lngCyEPde
— Input Output (@InputOutputHK) August 31, 2021
According to an earlier announcement, IOHK developers announced that the Alonzo hardfork would officially arrive on September 12.
Despite being a rebel coin, Cardano price seems to be running out of fuel and shows signs of exhaustion that could lead to a sharp descent. Therefore, investors need to pay close attention to the RSI, which is above the 70-level or the overbought zone.
While technicals and on-chain metrics hint at a grim outlook for ADA, the only place for hope is the big crypto. If Bitcoin price continues to head higher in an explosive manner, it is likely that more capital will flow into it, which will eventually find its way to altcoins like Cardano.
Such a development might decrease the severity of the drop and prematurely kick-start an uptrend.
Author

Akash Girimath
FXStreet
Akash Girimath is a Mechanical Engineer interested in the chaos of the financial markets. Trying to make sense of this convoluted yet fascinating space, he switched his engineering job to become a crypto reporter and analyst.



