Here is how miners could be manipulating Bitcoin price
- Miner flows provide an insight into Bitcoin price action but must be used alongside other metrics.
- Increasing exchange withdrawals, in general, suggest that Bitcoin is in a bull market.
- Bitcoin rally to $60,000 jeopardized by the resistance at the 50 SMA on the 4-hour chart.

Miners within the Bitcoin network are rewarded in coins (BTC) for their revenue. Besides holding the BTC, miners offload their bags on exchanges to get cash, which covers rent and electricity elements. Miner exchange inflow has for a long time not been considered a significant impact on the price. However, the emergence of on-chain metrics could disapprove of that notion, hence the need to take a closer look at miners’ activity.
Understanding Bitcoin price correlation to miner activity
Bitcoin has been in a persistent bull cycle since the last quarter of 2020. Despite the consistent rally, retracements have come into the picture – for instance, early this week, BTC tumbled from $58,000 to $45,000.
According to Glassnode’s Bitcoin spent output lifespan on a 30-day trailing average, the activity of miners who have been in the industry for more than ten years have signified several local tops.
Note that the miners moved chunks of at least 1,000 BTC to exchanges since the beginning of December. The chart below indicates instances when Bitcoin price dropped after a surge in miner exchange inflow.
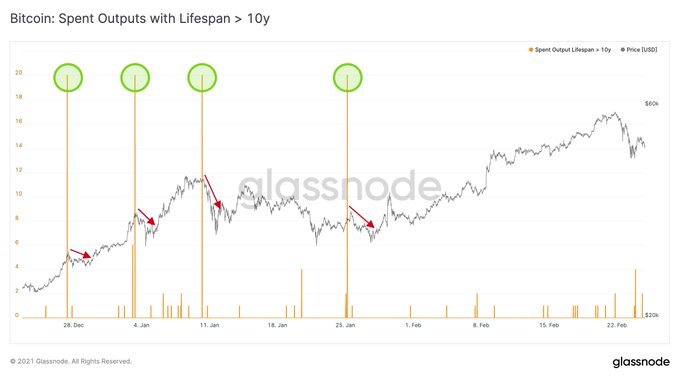
Bitcoin spent output lifespan
The miner inflow chart highlights the volume of coins transferred into miner addresses. Over the last ten years, an increase in miner inflow has led to a Bitcoin price spike. The degree of growth varies, which means that other factors must be considered when using this metric to predict BTC price action.
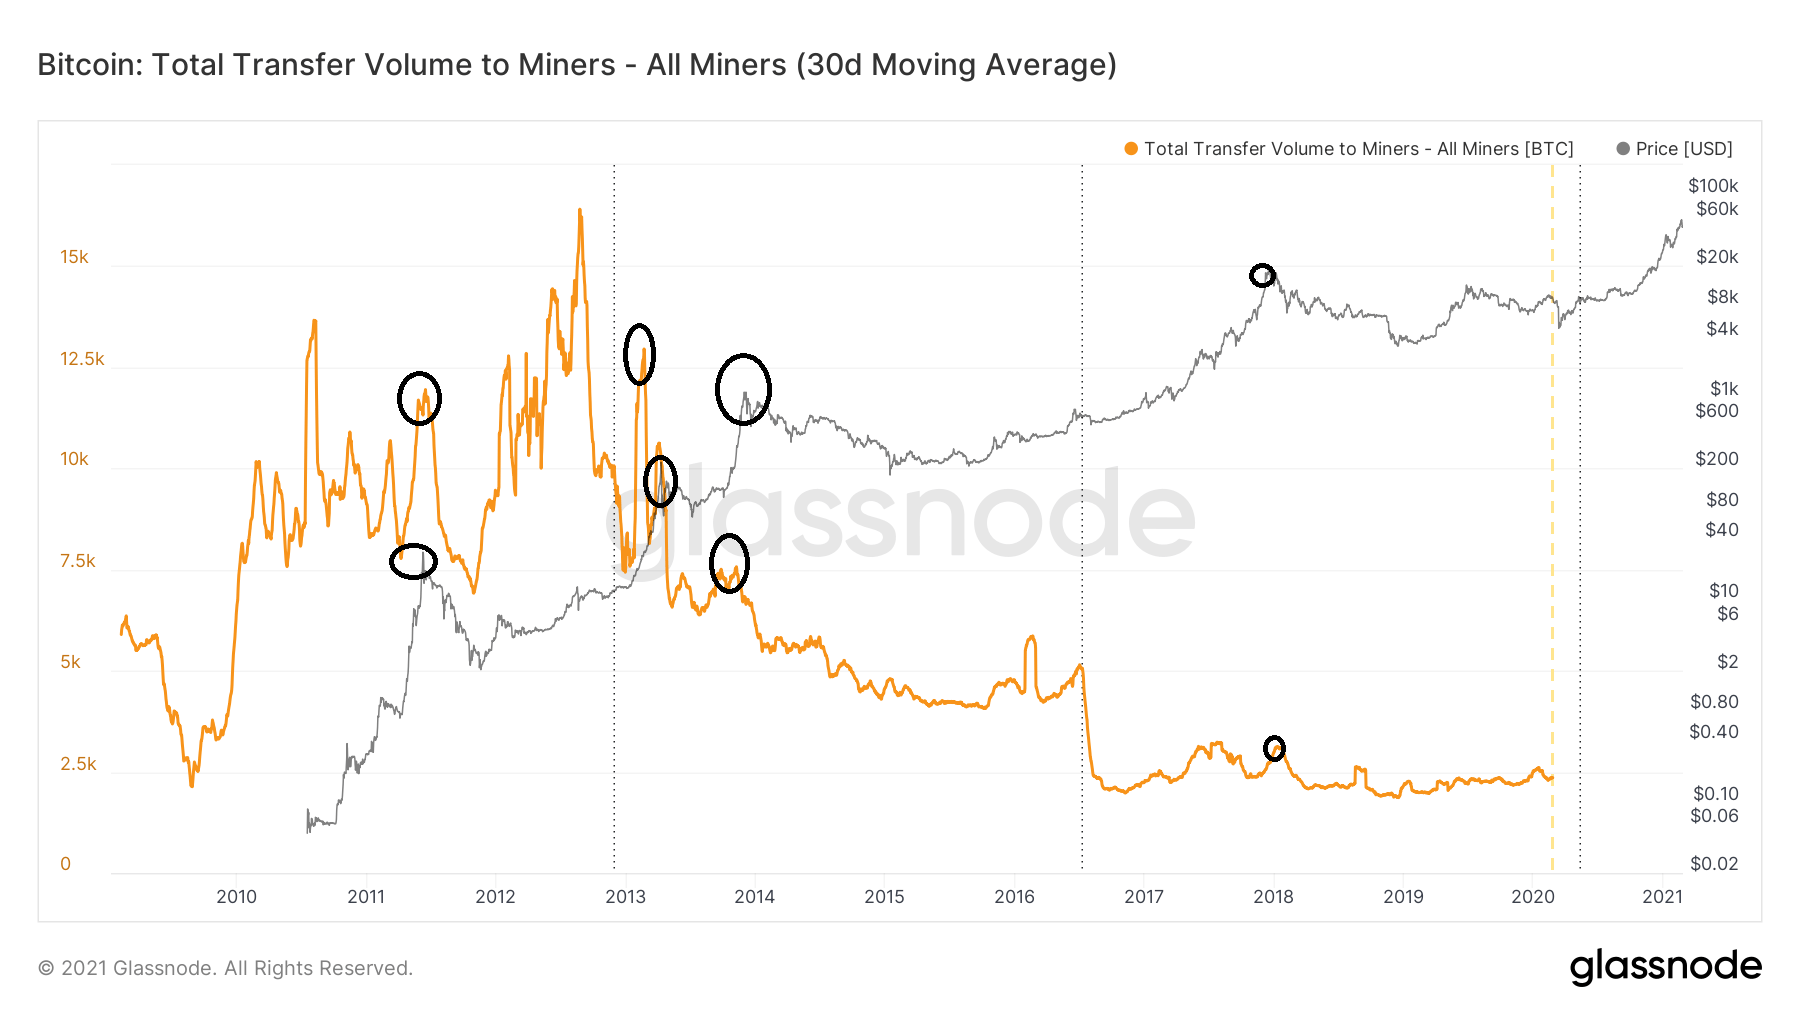
Bitcoin miner inflow
The Bitcoin miner transfers to exchanges also seem to validate the above metrics by illustrating that a higher volume sent to exchange leads to a drop in price. For example, the fall at the beginning of January preceded a consistent increase in miner exchange inflow.
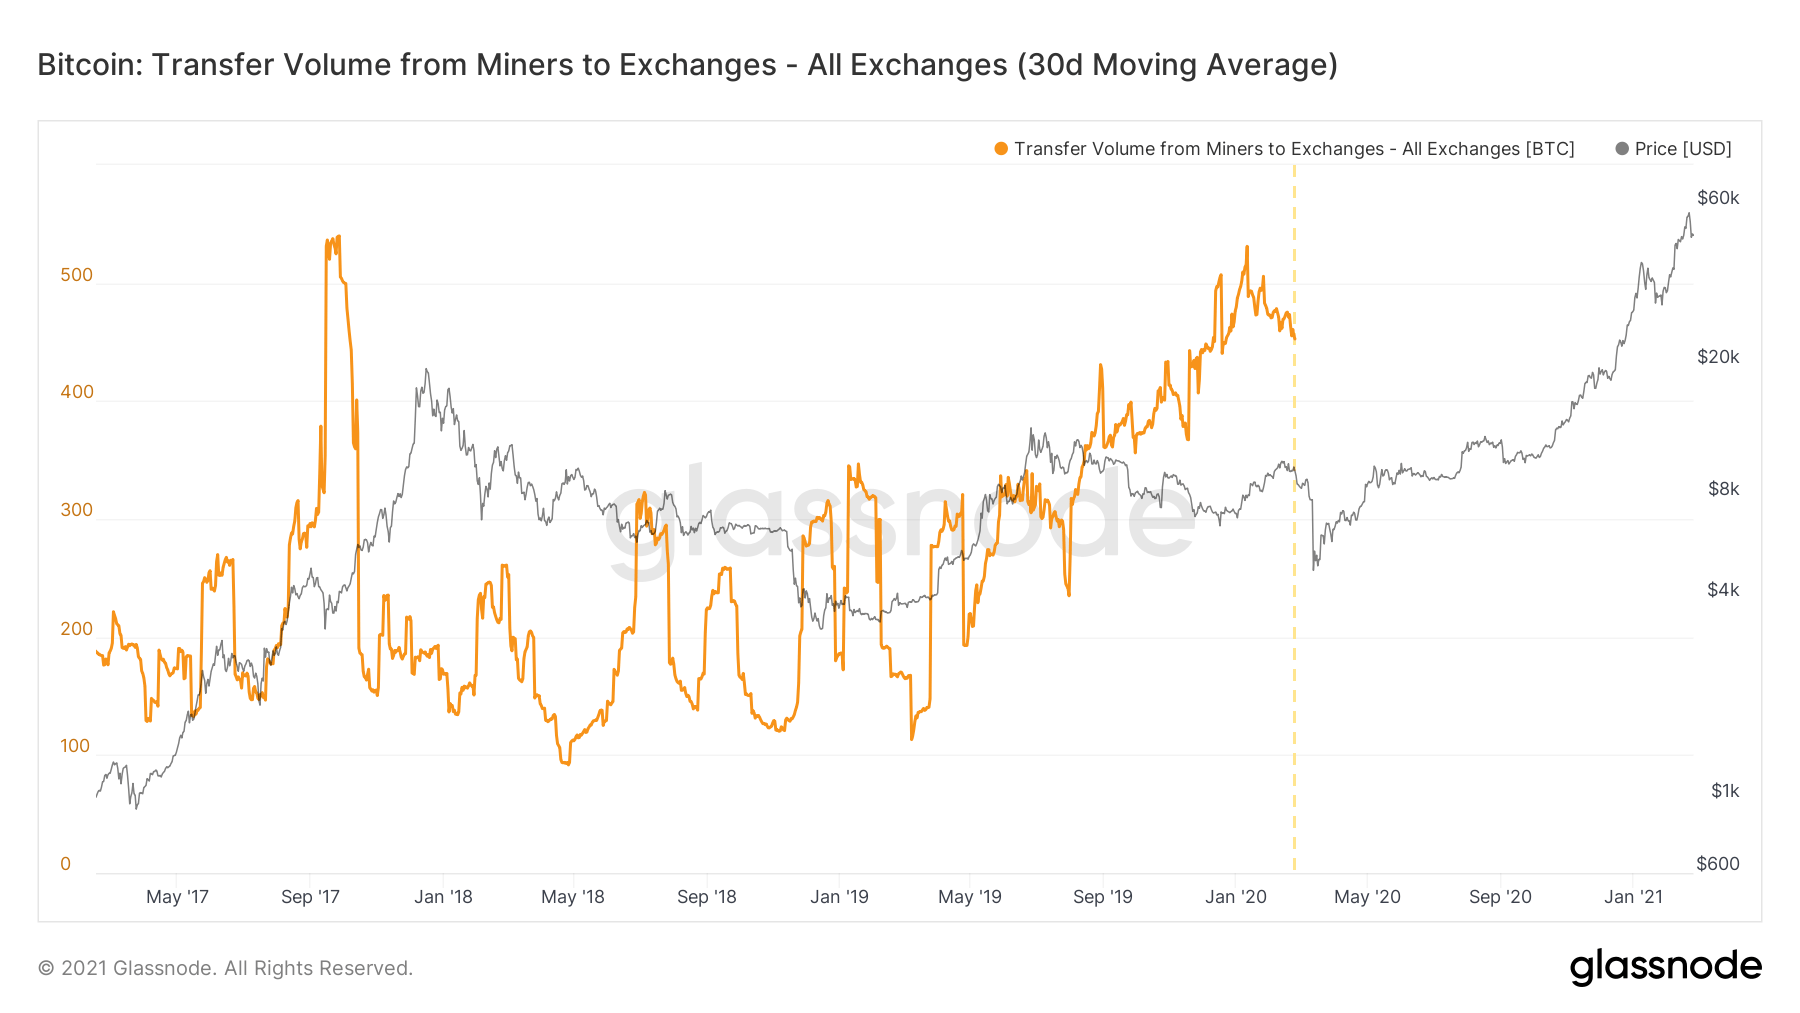
Bitcoin miner exchange volume
Generally, surging exchange withdrawals lead a significant bull runs. Note that the exchange withdrawals reduce reserves on platforms, consequently leading to diminishing supply. If the demand for Bitcoin remains the same or rises, Bitcoin price rallies to a new level. These demand and supply mechanisms can be observed on the chart.
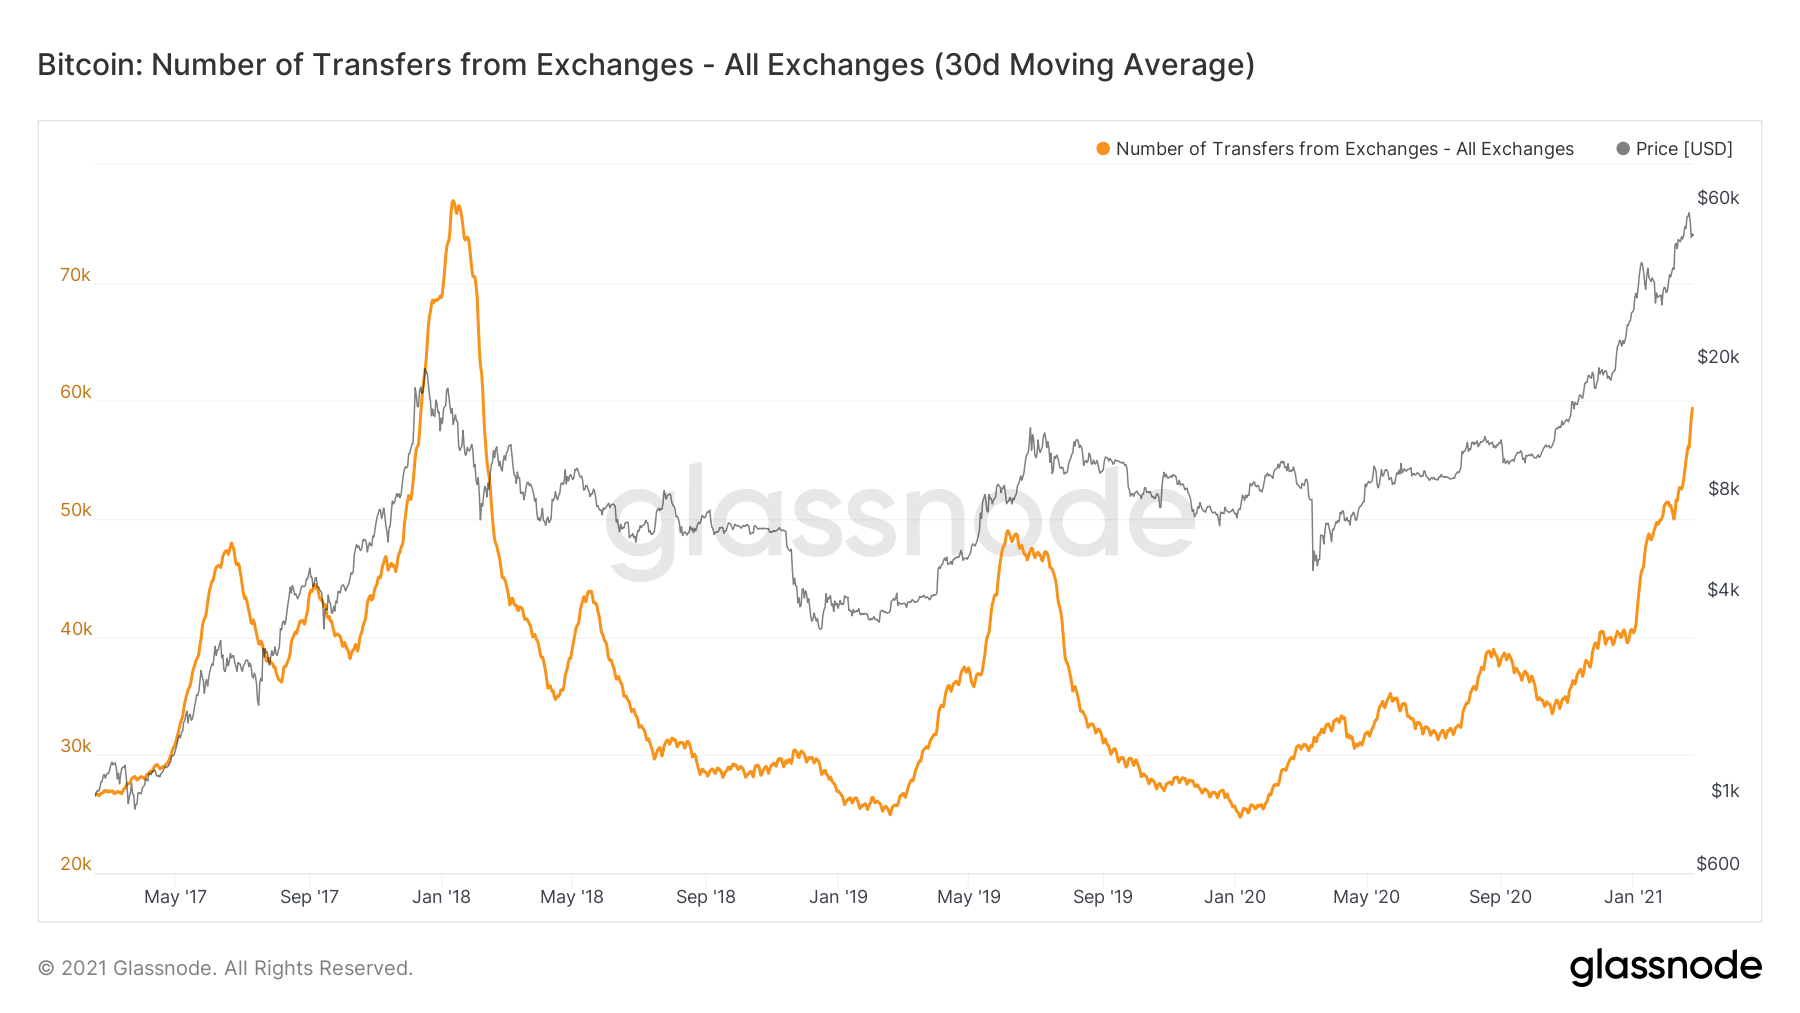
Bitcoin exchange withdrawals
Looking at the other side of the fence
A recent report by Coinmetrics argues that miner-exchanges flows, exchange deposits and withdrawals are not in any way correlated to Bitcoin price. The research says that Bitcoin price “rarely move in tandem” with these metrics.
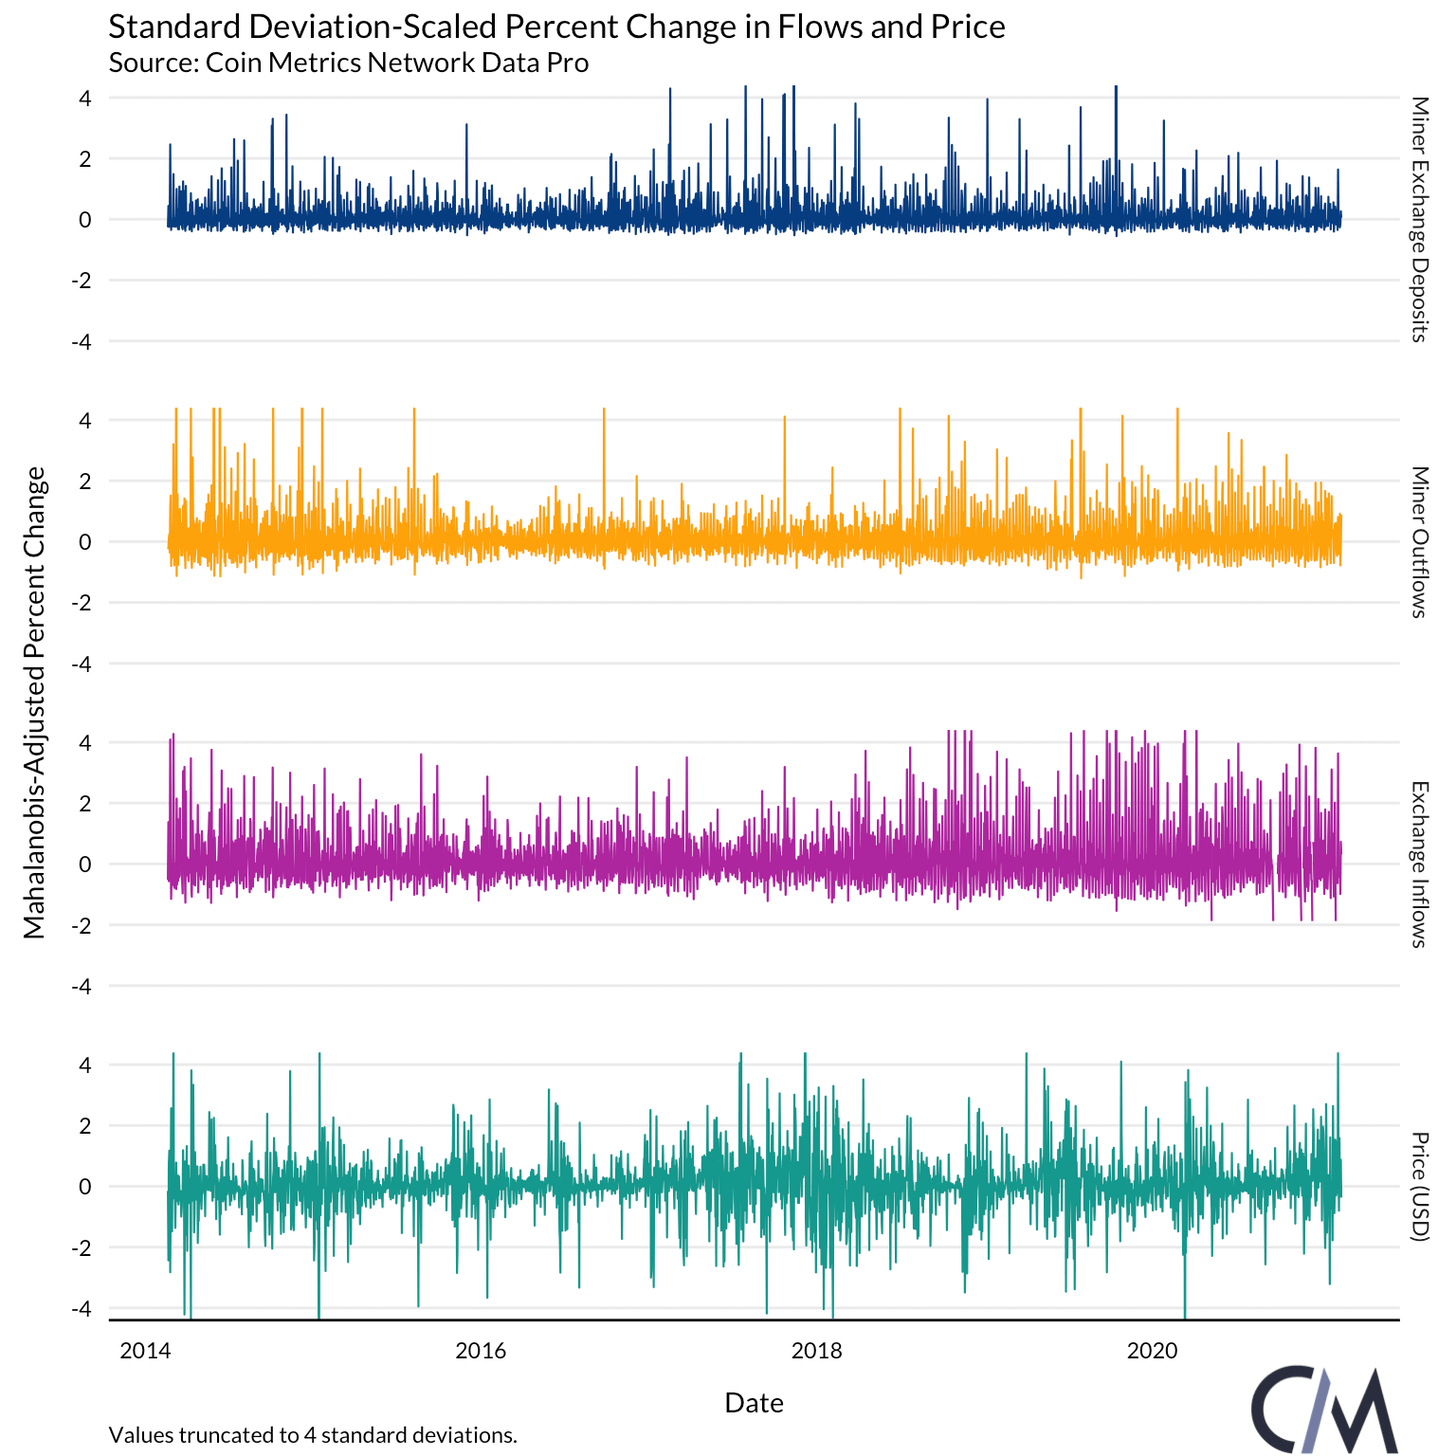
Bitcoin miner flows data
Econometric’s latest report, however, admits that the data has some blind spots. It also says that some miners prefer to sell on OTC desks. The research is accurate on the idea that miners sell on very few exchanges and mainly on Binance and Huobi.
Bitcoin price losses critical support
Bitcoin price has lost the support explored earlier at $50,000 and highlighted by the 50 SMA. If this support is not reclaimed, the bellwether cryptocurrency may freefall to retest support at $47,500. In the event this support is overwhelmed, the weekly anchor at $45,000 will come in handy.
%20-%202021-02-25T135941.559-637498483160493949.png)
BTC/USD 4-hour chart
On the flip side, the Moving Average Convergence Divergence (MACD) reveals that Bitcoin is gradually entering the bullish territory. Besides, a break above the 100 SMA at $52,500 will pave the way for gains toward $60,000.
Author

John Isige
FXStreet
John Isige is a seasoned cryptocurrency journalist and markets analyst committed to delivering high-quality, actionable insights tailored to traders, investors, and crypto enthusiasts. He enjoys deep dives into emerging Web3 tren




