Hedera Hashgraph Price Prediction: A potential bullrun with caution
- Hedera Hashgraph price witnessed a 125% rally in January.
- HBAR may rally towards $0.10 liquidity zone based on the strong influx of volume.
- Invalidation of the bullish thesis could occur from a breach below the recent swing low at $0.060

Hedera Hashgraph price shows potential to continue its uptrend. The consolidation phase could be viewed as a buying opportunity in hindsight. However, the risk to the downside should be considered.
Hedera Hashgraphprice still in an uptrend
Hedera Hashgraph price currently auctions at $0.069 as the scalable smart contract token is going through a phase of consolidation following its’ 125% rally last month. At the time of writing, the cryptocurrency trades beneath the hundred-day simple moving average and above the 50-day simple moving average. The squeeze effect on smaller time frames is likely to resolve in a powerful move, either bullish or bearish.
The volume indicator suggests that the Hedera Hashgraph price is in a strong uptrend, as the current sell-off shows a substantially less number of transactions than the largest green candlestick in the trend, which had a total of $8.54 billion in transactions between January 17th to January 19th. The volume indicators suggest that bulls in the market are still holding on to their positions in anticipation of another move north.
If the uptrend continues, the bulls could challenge untagged liquidity levels from the 2021 market decline lie near the $0.10 zone. A breach of this level would result in a 46% increase in market value from HBAR’s price today.
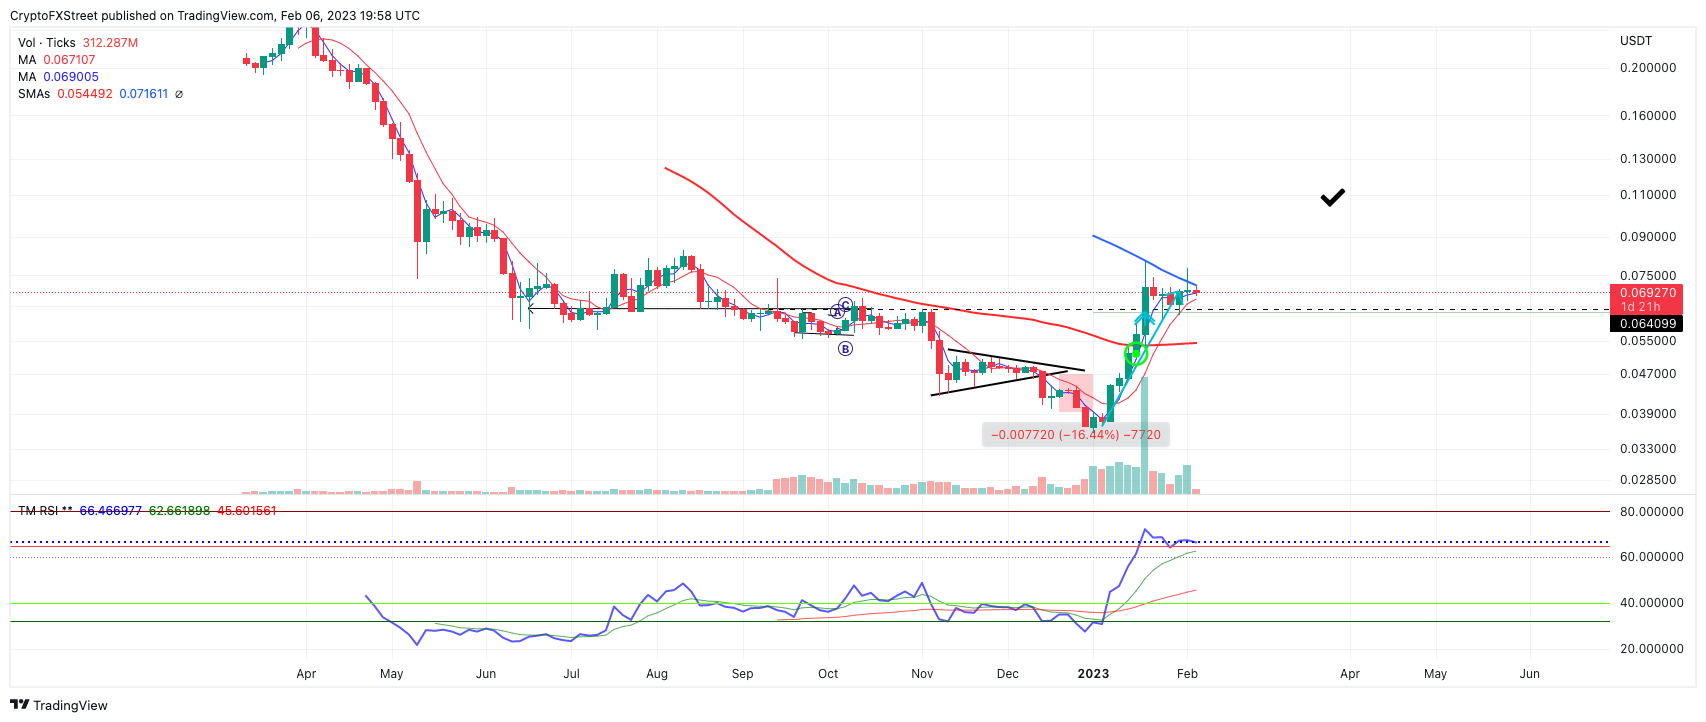
HBAR/USDT 1-Day Chart
On the contrary, A breach of the 0.060 swing low could invalidate the optimistic outlook and prompt further decline. The 50-day simple moving average would be the first bearish Target lying at 0.050. HBAR would decline by 20% if the bears were to conquer the trend.
Author

Tony M.
FXStreet Contributor
Tony Montpeirous began investing in cryptocurrencies in 2017. His trading style incorporates Elliot Wave, Auction Market Theory, Fibonacci and price action as the cornerstone of his technical analysis.


