- Bitcoin price flip-flops again this week above and below $20,000.
- BTC price is trading in a few technical patterns that spell more mayhem.
- Instead, look for $16,020 or $24,000 to make your trading plan long or short.
Bitcoin price sees a sharp drop in volatility as the new monthly pivots come in more narrowly from each other than the ones in June. A similar pattern can be spotted between April and May, where in May, the falling knife got executed that at one point had wiped out 30% of the market cap. The risk at hand is that a similar move could happen in the coming month as almost two hands are needed to count all the bearish signals in Bitcoin.
If BTC price were a bet, it would quote 5 to 1
If it were a bet, Bitcoin price would be quoted at the betting shops 5 to 1 as currently, five bearish elements outweigh only one bullish signal. With that, it looks to be a done deal and a concise article to make, but there is one important thing to mention, which you can read in the last paragraph. For now, let us focus on the bearish elements at hand and the ones that need to be broken before markets can start speaking of an uptrend instead of a bear trend.
BTC price is already mentioned in several articles in a downtrend marked by the death cross where the 55–day Simple Moving Average (SMA) has broken below the 200-day SMA, and to make it even worse, that same 55-day SMA is working as a cap on the price action moving alongside the downtrend as a watchdog. Parallel with that declining 55-day SMA, a red descending trend line is acting as the backbone of the downtrend, forming a bearish triangle with the base at $19,036 and acts as the upper leg of a bearish trend channel with the old blue ascending trend line as the lower leg. Reading back, that makes five bearish elements currently hanging over BTC price action and only dragging it further down.
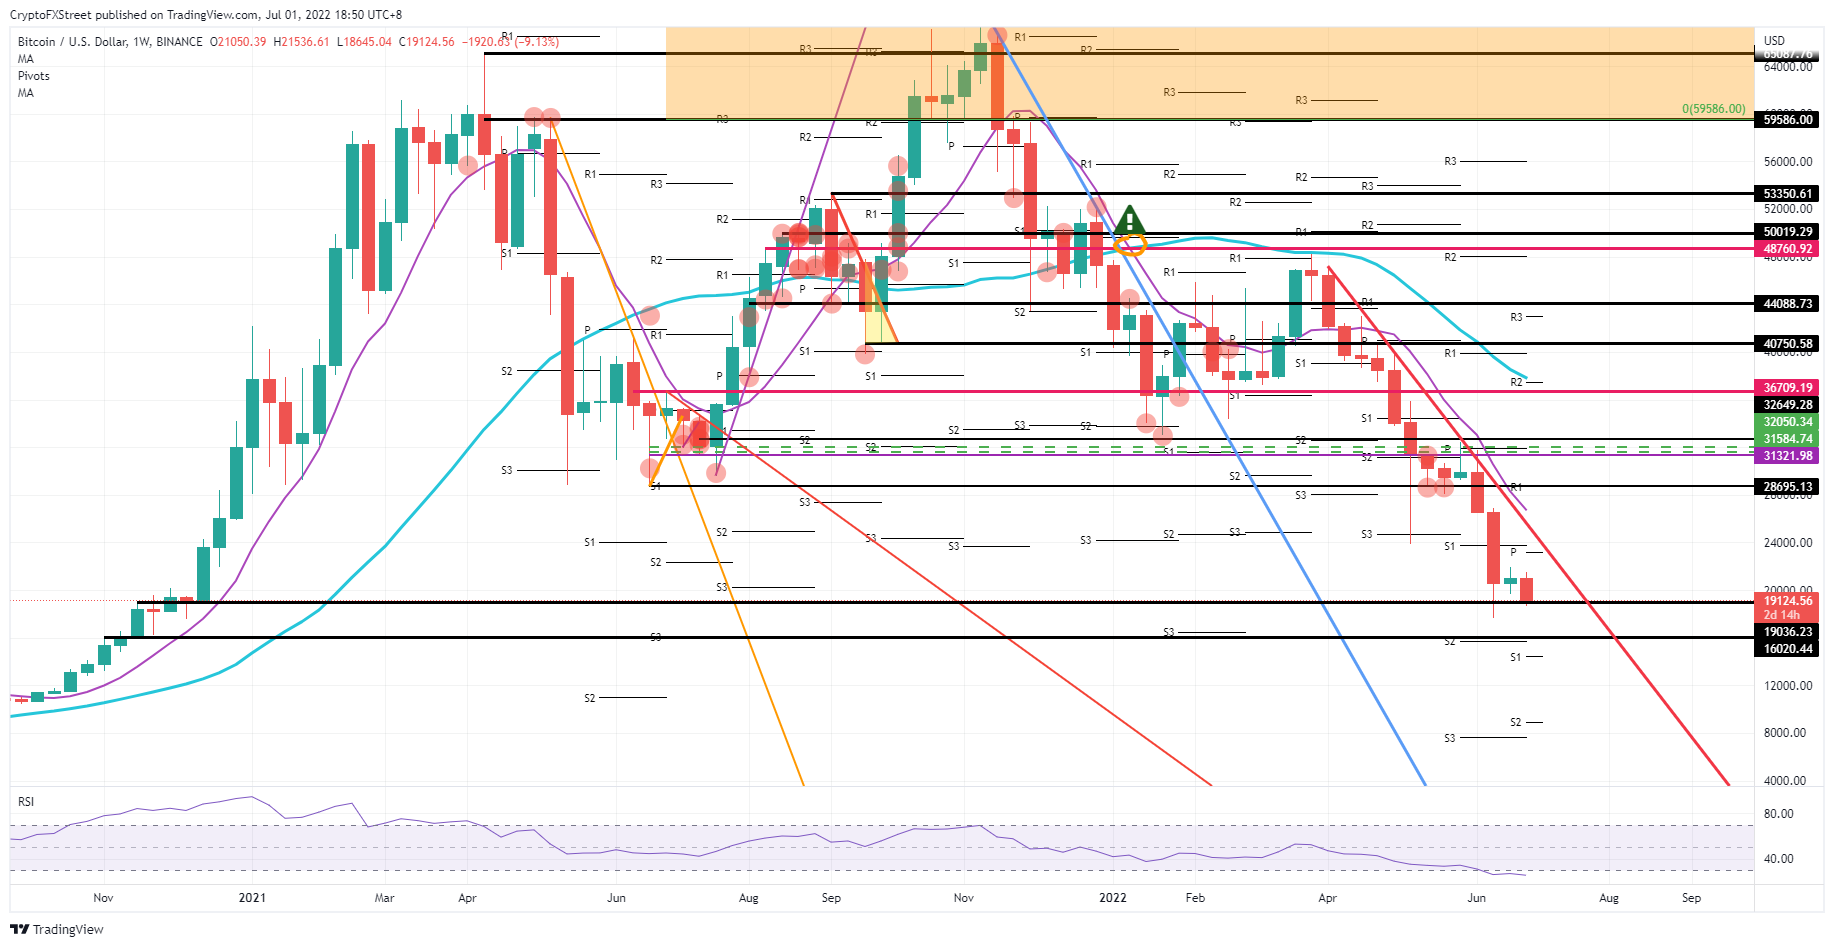
BTC/USD weekly chart
As mentioned in the introduction, the new monthly pivots are coming in close to one another, meaning that price action will only consolidate further and that support is much closer to one another to catch any further slides in the price action. BTC price will see support at $16,020, and the monthly S1 at $14,460 is nearby to catch any breaks. As the summer starts as well, the seasonal summer lull kicks in with lesser liquidity and building a case for bulls to strike now and pump price action up towards $28,695, breaking the red descending trend line and the 55-day SMA and pulling in inequality between bears and bulls into a full bullish playing field.
Information on these pages contains forward-looking statements that involve risks and uncertainties. Markets and instruments profiled on this page are for informational purposes only and should not in any way come across as a recommendation to buy or sell in these assets. You should do your own thorough research before making any investment decisions. FXStreet does not in any way guarantee that this information is free from mistakes, errors, or material misstatements. It also does not guarantee that this information is of a timely nature. Investing in Open Markets involves a great deal of risk, including the loss of all or a portion of your investment, as well as emotional distress. All risks, losses and costs associated with investing, including total loss of principal, are your responsibility. The views and opinions expressed in this article are those of the authors and do not necessarily reflect the official policy or position of FXStreet nor its advertisers. The author will not be held responsible for information that is found at the end of links posted on this page.
If not otherwise explicitly mentioned in the body of the article, at the time of writing, the author has no position in any stock mentioned in this article and no business relationship with any company mentioned. The author has not received compensation for writing this article, other than from FXStreet.
FXStreet and the author do not provide personalized recommendations. The author makes no representations as to the accuracy, completeness, or suitability of this information. FXStreet and the author will not be liable for any errors, omissions or any losses, injuries or damages arising from this information and its display or use. Errors and omissions excepted.
The author and FXStreet are not registered investment advisors and nothing in this article is intended to be investment advice.
Recommended Content
Editors’ Picks
Ripple's move above this key level could trigger nearly 50% rally for XRP
Ripple has overcome a critical resistance level and flipped into a support floor on the weekly time frame. This development happened while XRP tightly consolidated for roughly 250 days. Investors can expect XRP to kickstart a massive rally.
Optimism price outlook with nearly $90 million worth of OP tokens flooding markets on Friday
Optimism volatility has shrunk in the ours leading to the network’s cliff unlock. It joins the likes of dYdX and Sui, which have similar events on their calendars. As token unlocks are often considered bearish catalysts, investors should brace for a reaction after the event.
Top 3 Price Prediction Bitcoin, Ethereum, Ripple: Retail watches from the sidelines with a bias for shorts
Bitcoin could clear $73,777 peak as BTC bulls resurface. Ethereum might fall 10% before next leg up as ETH RSI teases with sell signal. XRP could lose $0.6000 threshold as Ripple bulls fail to show up.
Jito price could hit $6 as JTO coils up inside this bullish pattern
Jito price action shows a potential cup and handle formation. Based on theoretical measurement rules, a successful breakout could yield a 56% rally to $6.0. A breakdown of the $3.86 support level would create a lower low for JTO and invalidate the bullish thesis.
Bitcoin: BTC may have recovered, but is it out of the woods?
Bitcoin’s (BTC) upward momentum has shown a significant decline for the past two weeks or so. This development led to a bearish signal on the weekly and an uncertain outlook on the monthly.