Bitcoin Weekly Forecast: This support level can define BTC’s fate
- Bitcoin price ended Q2 with a -56% return, which is the first in its 11-year history.
- On-chain metrics hint at bottom formation but technicals reveal more room to the downside.
- A weekly candlestick close below the $19,065 support level could trigger a 36% crash to roughly $12,000.

Bitcoin price has finished the first half of 2022 and things are not looking good. With record negative returns, BTC is likely to continue heading lower, especially if one particular support level is breached.
Bitcoin price straps in for the second half of 2022
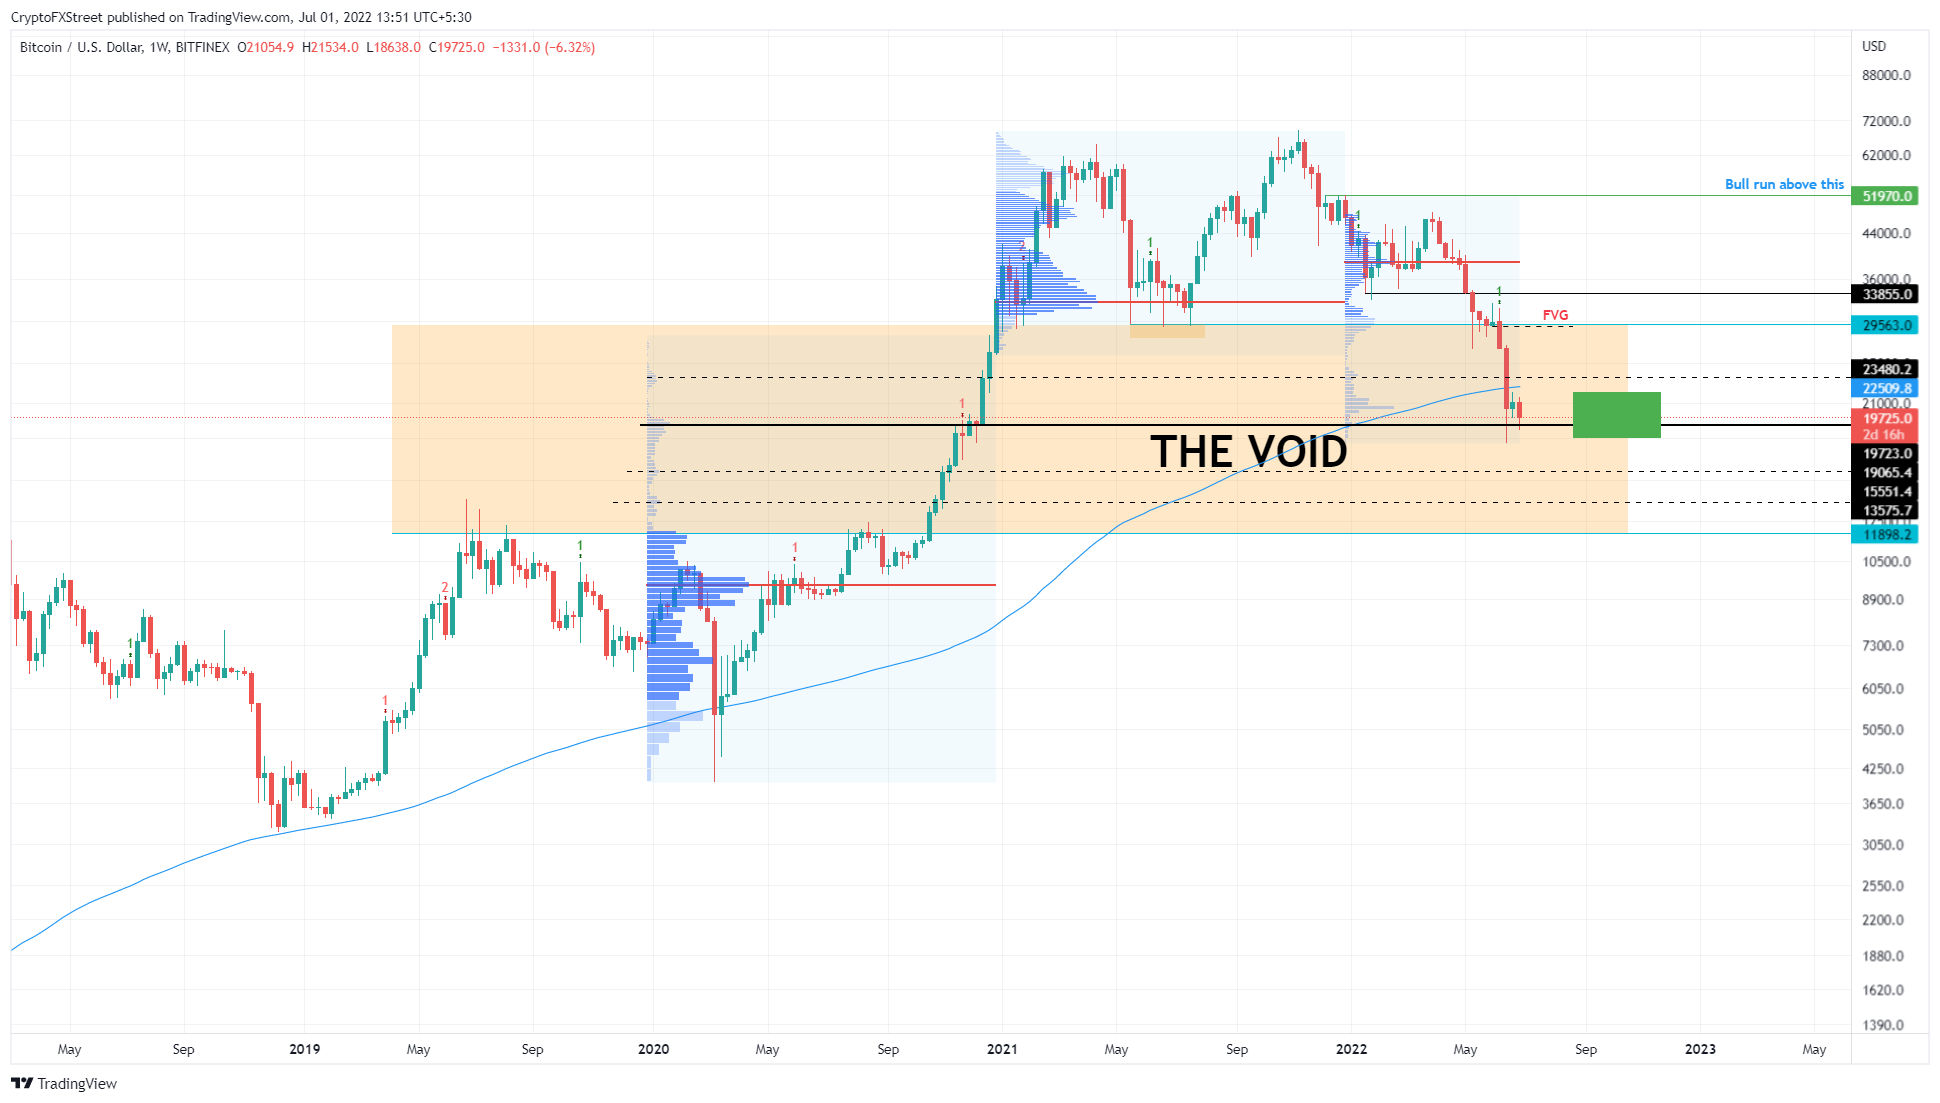
Bitcoin price crashed by 56% in Q2, making it the highest negative Q2 return in the 11 years of the blockchain’s existence. Regardless, the last few weeks have seen price action forming in a tight range, below the 200-week Simple Moving Average (SMA) at roughly $22,500.
Bitcoin price’s response to the major MA above it will indicate the strength of the bullish contingent, whilst the $19,065 support level will reveal bears’ intentions.
Assuming Bitcoin price manages to overcome the 200-week SMA – coinciding roughly with the $23,480 horizontal resistance level – and flips it into a support floor, it will indicate that the buyers are in control. This move will also reveal that a recovery rally is in play.
Such a situation will suggest that BTC is likely to continue its ascent to the next stiff hurdle at $29,563. This is where things get complicated for the big crypto. A decisive move above the aforementioned barrier will open the path for Bitcoin price to reach the 2022’s highest traded volume point of control (POC) at $38,990.
However, overall the bearish trend is still dominant and only a weekly candlestick close above $52,000 will create a higher high and confirm a long-term reversal.
BTC/USDT 1-day chart
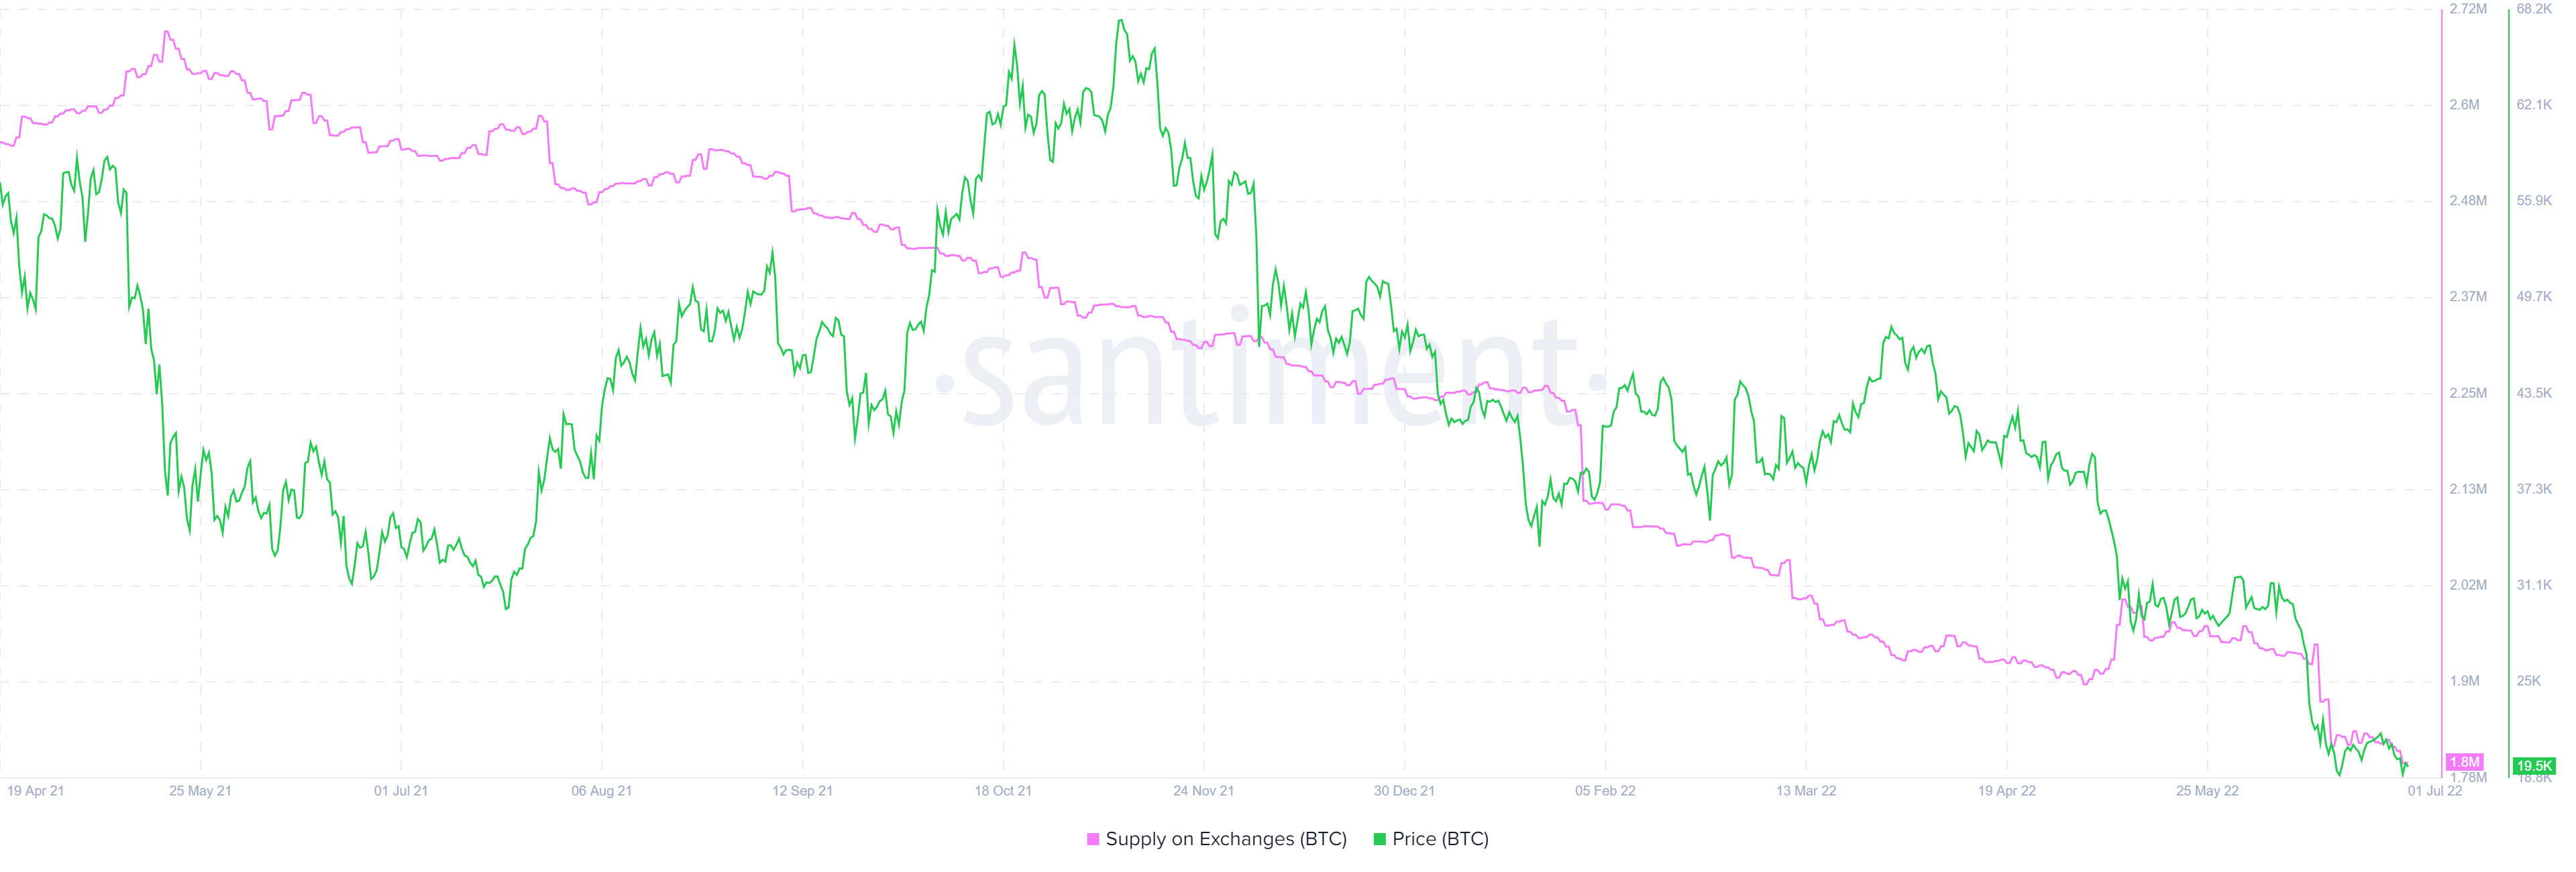
Passively supporting this bullish outlook is but only one chain metric - Supply on Exchanges. This index tracks the number of BTC held on exchanges, which has dropped from 1.94 million to 1.8 million over the last two weeks.
This 7.2% decline reveals that investors are moving their BTC holdings off centralized platforms, thereby reducing the effective sell-side pressure, which is in a way, bullish for Bitcoin price.
BTC Supply on Exchanges
Potential BTC bottom formation
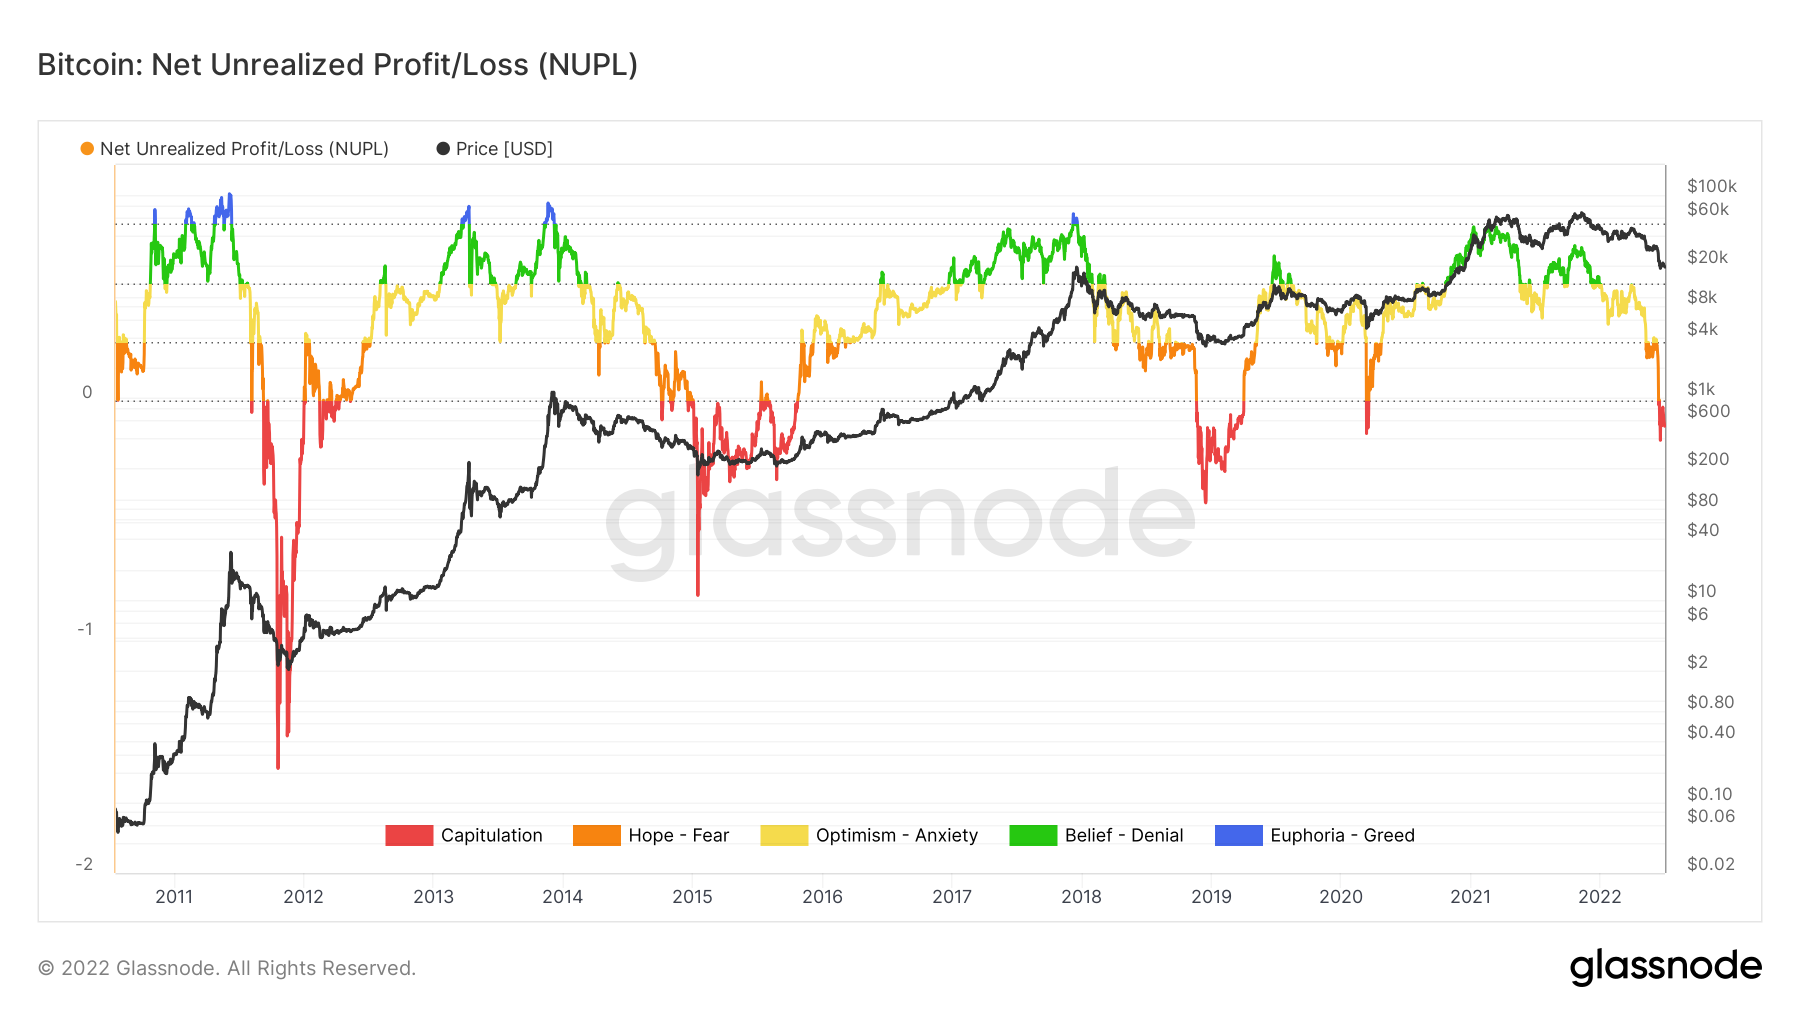
The next indicator is the Net Unrealized Profit/Loss (NUPL), which is showing that a bottom may be forming from a historical standpoint. However, a quick look at the chart shows that the bottom formation happens over a period and is not just one turning point.
The NUPL indicator measures the difference between holders with relative unrealized profit and relative unrealized loss. The result is used to represent the market sentiments and the shift in the numerical value of NUPL can be used to understand investors’ emotions, which in turn can help time market tops and bottoms.
The NUPL suggests that the market is toppy when it detects that investors’ sentiment is entering a “Greed” stage, which is often the best time to realize profits. As a result of this move, price corrections often accelerate, which further shifts the market sentiment from Greed to Denial, from Denial to Anxiety, from Anxiety to Fear, and from Fear to Capitulation.
Capitulation typically marks the cycle bottom.
As Bitcoin price crashed from its all-time high at $69,000 to $30,000 the NUPL journeyed from Greed to Fear. A further plummet in BTC price below $30,000 in June 2022 saw the market sentiment dive from Fear to Capitulation.
This indicator has been accurate for the past decade and shows that BTC investors are capitulating, which has often marked bottoms for each cycle. However, an interesting observation is that with each cycle, the capitulation period and magnitude has been declining. Hence, the current position of the NUPL cannot say with utmost certainty that a market bottom is in.
But one can at least assume that the bottom formation process has begun.
BTC NUPL
The volume profile indicator in the chart attached above shows that the $19,065 support level is a crucial point. A breakdown of this level suggests that a 36% crash to $11,898 is likely due to the lack of high-volume nodes.
However, investors can expect a slowdown at the $15,551 and $13,575 support floors in some cases. Regardless, a drop to the $12,000 psychological level seems plausible if bears manage to crack the $19,065 foothold.
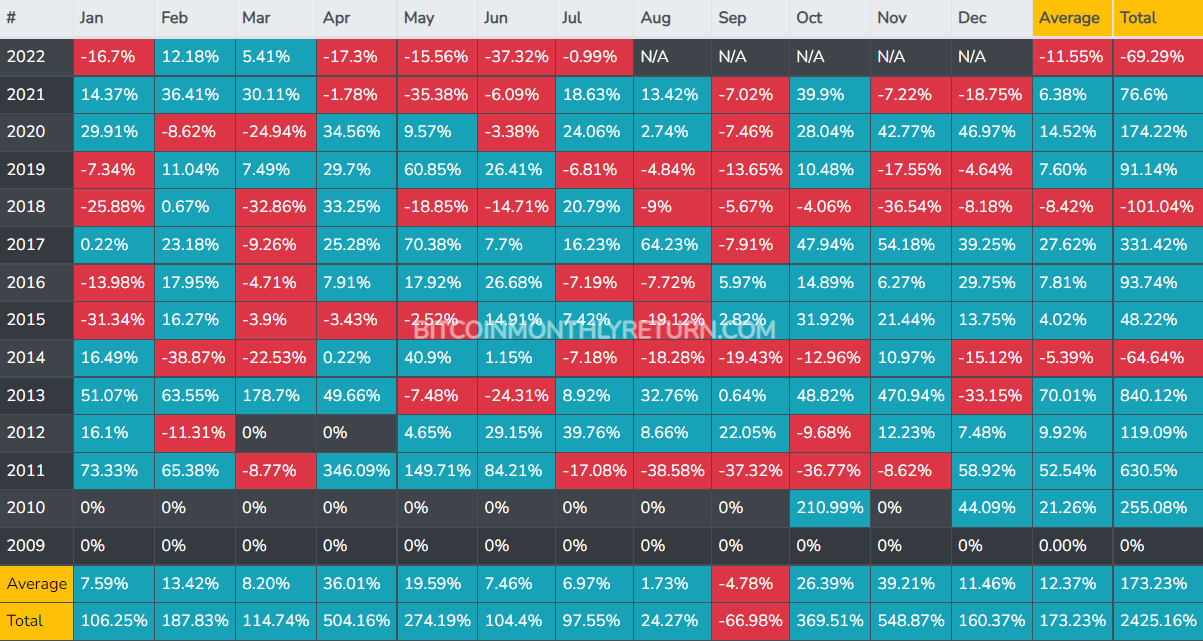
On the other hand, the monthly returns for Bitcoin price show that Q2 was a so-so quarter with single-digit returns possible. However, the upcoming Q3 is much worse and has an average return of -5.4%.
Therefore, expecting BTC to rally in Q3 seems unlikely.
BTC monthly returns
To sum it up, a weekly candlestick close below $19,065 will spell doom for Bitcoin price and crash it violently to $12,000 or lower. Investors need to exercise caution on opening leveraged long positions based on the assumption that the bear market has ended.
Author

Akash Girimath
FXStreet
Akash Girimath is a Mechanical Engineer interested in the chaos of the financial markets. Trying to make sense of this convoluted yet fascinating space, he switched his engineering job to become a crypto reporter and analyst.


