Fetch.ai price to extend decline after testing major resistance level
- Fetch.ai faces resistance at $1.65, the 61.8% Fibonacci retracement level in the weekly chart, and trades below $1.46 on Friday.
- On-chain data shows FET’s investors are booking profits, and supply on exchanges is increasing, signaling a bearish momentum.
- A weekly candlestick close above $1.65 would invalidate the bearish thesis.
Fetch.ai (FET) price is encountering resistance at $1.65 this week, with current trading below $1.46 as of Friday. On-chain data reveals that FET’s investors are taking profits, leading to an uptick in supply on exchanges. This indicates a bearish momentum that could potentially drive down FET's price in the coming days.
Fetch.ai price set for a downward move
Fetch.ai price faces resistance at $1.65, the 61.8% Fibonacci retracement level from the weekly swing low of $0.51 on February 5 to the weekly swing high of $3.48 on March 25. At the time of writing, FET trades at $1.46 on Friday.
If this support level cannot hold and FET closes below the 200-week Exponential Moving Average (EMA) around the $1.30 level, it could crash 30% to retest its next weekly support level at $0.89.
The momentum indicators support this bearish scenario. The Relative Strength Index (RSI) on the weekly chart has briefly slipped below the 50 mean level, while the Awesome Oscillator (AO) is on its way to doing the same. These momentum indicators strongly indicate bearish dominance.
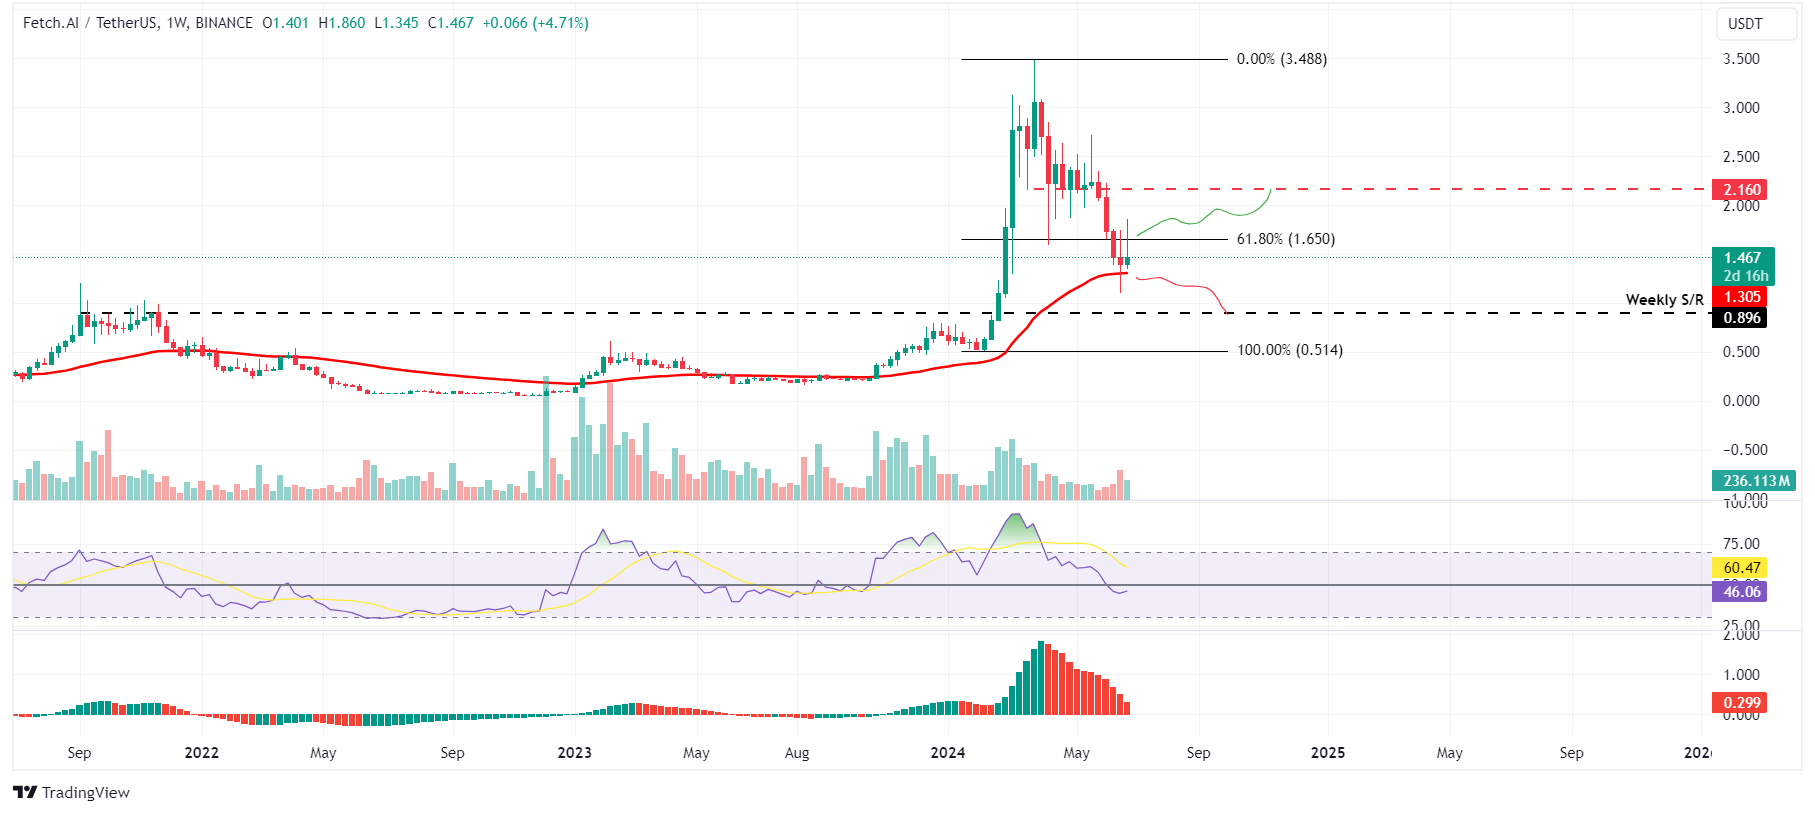
FET/USDT weekly chart
Santiment’s Age Consumed index aligns with the bearish outlook noted from a technical perspective. The spikes in this index suggest dormant tokens (tokens stored in wallets for a long time) are in motion and can be used to spot short-term local tops or bottoms.
For FETs, history shows that the spikes were followed by a decline in the Fetch.ai price. The most recent uptick on June 27 also forecasted that FET is ready for a downtrend.
%20[14.14.05,%2028%20Jun,%202024]-638551704059958283.png)
FET Age Consumed chart
On-chain data provider Santiment’s Network Realized Profit/Loss (NPL) indicator computes a daily network-level Return On Investment (ROI) based on the coin’s on-chain transaction volume. Simply put, it is used to measure market pain. Strong spikes in a coin’s NPL indicate that its holders are, on average, selling their bags at a significant profit. On the other hand, strong dips imply that the coin’s holders are, on average, realizing losses, suggesting panic sell-offs and investor capitulation.
In FET’s case, the NPL indicator spiked 1.06 million to 34.41 million on June 26 and 27, coinciding with an 11% price rise. This upward spike indicates that the holders were, on average, selling their bags at a significant profit.
During this event, the FET’s supply on exchanges rose from 145.49 million to 173.01 million in two days. This increase in supply indicates that investors are moving FET tokens to exchanges and increasing selling activity, signaling a bearish outlook.
%20[14.27.54,%2028%20Jun,%202024]-638551704666126360.png)
FET Network Realized Profit/Loss and Supply on Exchanges chart
Even though the on-chain metric and technical analysis point to a bearish outlook, a FET’s weekly candlestick close above $1.65 would invalidate the bearish thesis by producing a higher high on the weekly timeframe. This development could see Fetch.ai’s price rally 31% to the next weekly resistance level of $2.16.
Author

Manish Chhetri
FXStreet
Manish Chhetri is a crypto specialist with over four years of experience in the cryptocurrency industry.


