Fantom price could rally 20% but needs to test major support level first
- Fantom price could rally 20%, but only after retesting the range support extending from $0.759 to $0.695.
- On-chain data suggest that investors are accumulating.
- A daily candlestick close below $0.640 would invalidate the bullish thesis.

Fantom (FTM) price has lost some steam after the sharp increase registered from May 15 to May 20 but looks poised for further gains, technical indicators and on-chain data show. However, before this happens, a decline to test a major support range is needed so the rally can continue.
Fantom price looks set for additional gains
Fantom price gained 22% after breaking out on May 16, surpassing both the 50-day Exponential Moving Average (EMA) at $0.737 and the daily resistance level at $0.7614.
Following this, it encountered resistance at $0.9673, inside the daily order block area extending between $0.953 and $1.047 from April 10. An order block is an area where market participants, such as institutional traders, have placed huge sell orders.
Due to this, FTM tokens tumbled 21% from their high of $0.9673 and found support at the 50-day EMA at $0.765 on May 23, coinciding with the 61.8% Fibonacci retracement.
The Relative Strength Index (RSI) is currently at 53, which is higher than the mean of 50, indicating that the bulls still have steam to push the FTM price higher.
If the 50-day EMA, daily support level, and 61.8% Fibonacci retracement level hold, FTM could rally by 20% to its previous daily high of $0.967 from May 20.
If the bulls are vigorous, it could rally by 47% to test its daily close level of 1.127 from March 26.
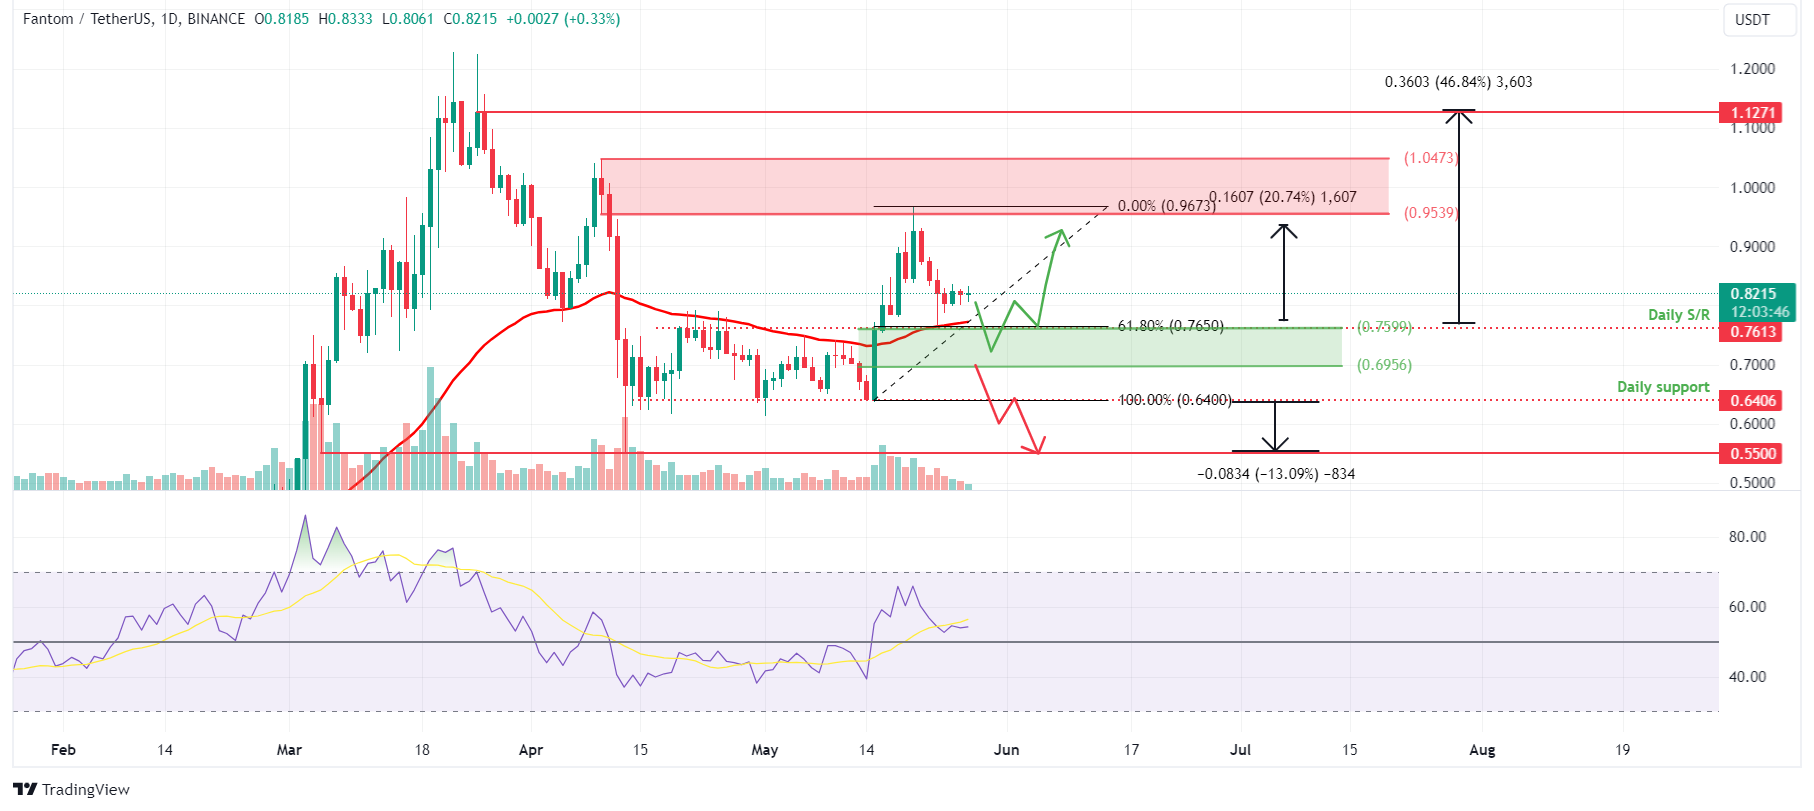
FTM/USDT 1-day chart
According to IntoTheBlock's In/Out of the Money Map (IOMAP), about 545 addresses have acquired 141.06 million FTM tokens. These addresses purchased the FTM token between $0.768 and $0.791, indicating a crucial support zone. If the price falls, these investors are likely to increase their holdings.
The $0.768 to $0.791 zone stated in the technical analysis corresponds with the IOMAP findings, making it an important reversal zone to monitor.
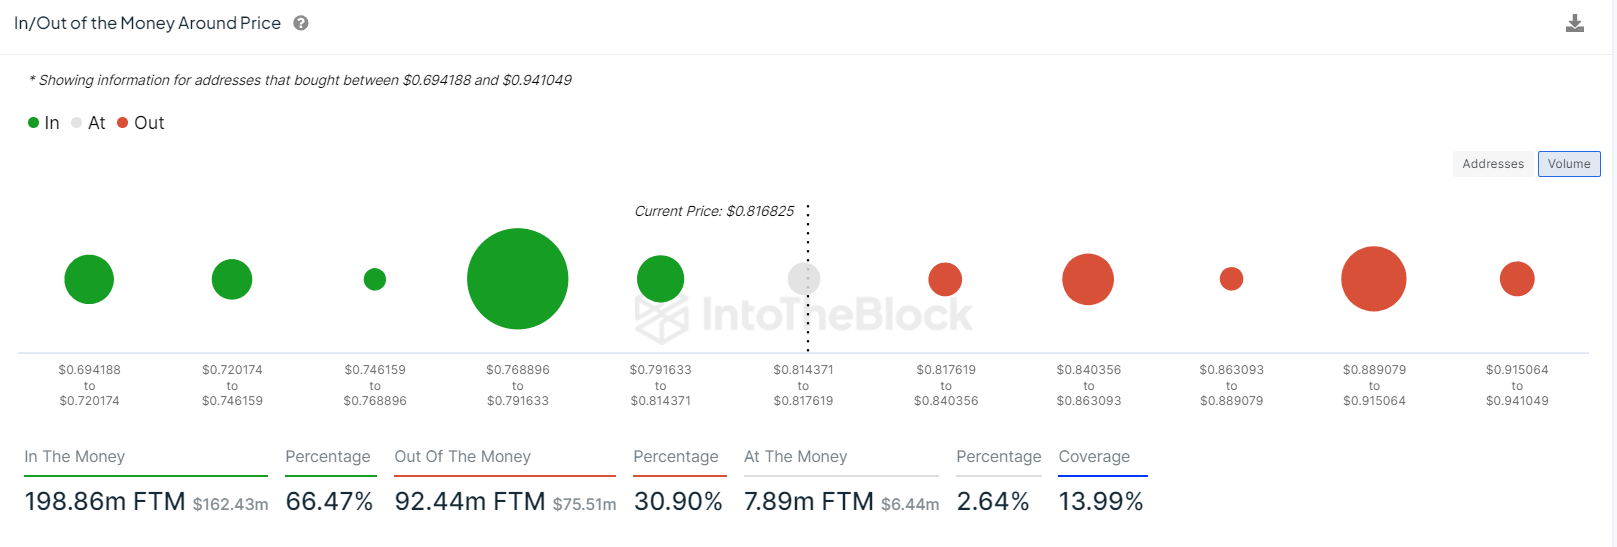
FTM IOMAP chart
The Large Holders Netflow indicator from IntoTheBlock provides insight into the changes in the positions of investors who own more than 0.1% of the supply. In short, netflow spikes imply accumulation by major players, whereas drops suggest reduced positions or selling.
For FTM, the recent spike in large holdings netflow indicates significant buying activity and may imply bullish price momentum.
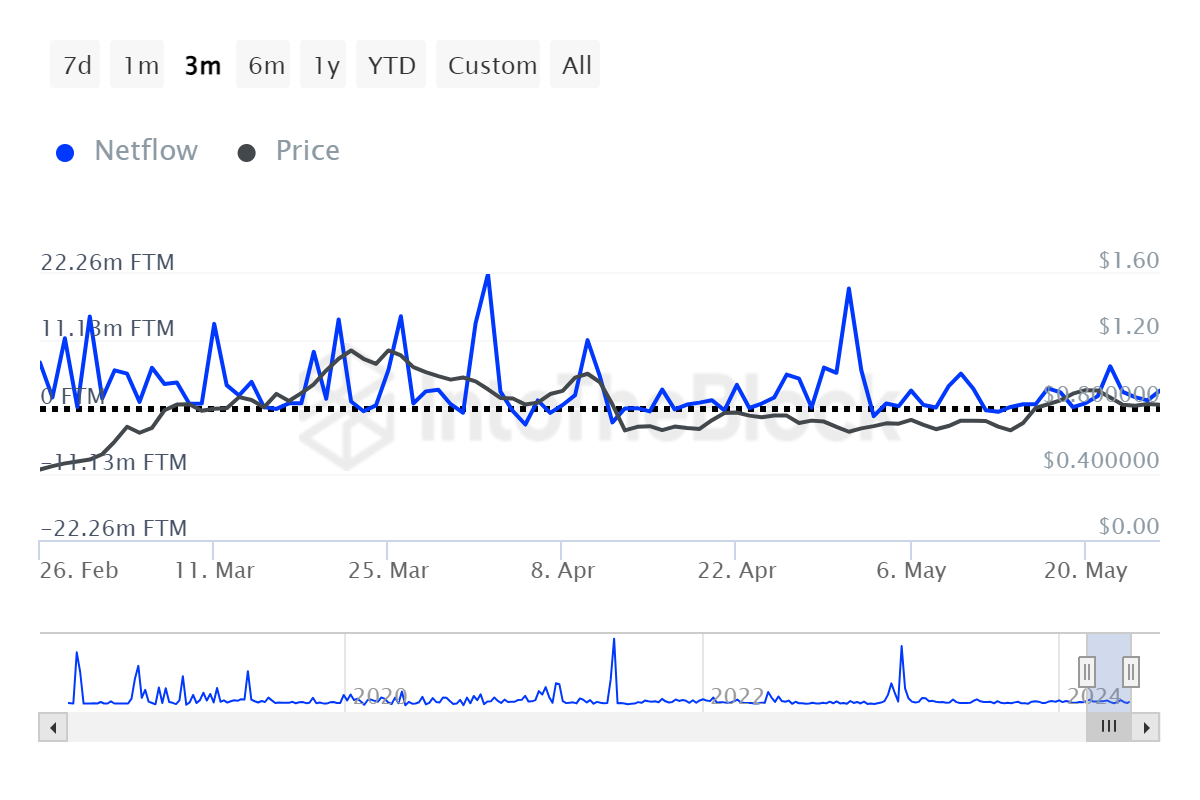
FTM Large Holders Netflow chart
Despite the bullish outlook pictured by technical analysis and on-chain data, if FTM price posts a daily candlestick close below the May 15 daily support zone of $0.640, it will form a lower low. This scenario would signal a bearish outlook, possibly leading to a price fall of around 13% to the April 13 low of $0.550.
Author

Manish Chhetri
FXStreet
Manish Chhetri is a crypto specialist with over four years of experience in the cryptocurrency industry.


