Dogecoin eyes 10% rally as DOGE bulls show strength
- Dogecoin price is likely to rally 10%, after breaking resistance level of $0.118.
- On-chain data suggest DOGE investors are accumulating.
- A daily candlestick close below $0.135 would invalidate the bullish thesis.
Dogecoin (DOGE) price surges after 36 days of consolidation, breaking the range.
The price action produces higher highs and higher lows, suggesting the exhaustion of bears and bulls taking over. On-chain data also indicates that the bulls are in control and accumulating, with DOGE potentially rallying.
Dogecoin price looks optimistic
Dogecoin price broke out on May 20 and rallied 6% from a 36-day consolidation range of $0.162 and $0.118.In doing so, it produces a higher high and higher low and found support around the 50-day Exponential Moving Average (EMA), which is hovering around the $0.155 level.
If the 50-day EMA holds, DOGE could bounce 10% to the $0.186 level, which is a 61.80% Fibonacci retracement level. Both the Relative Strength Index (RSI) and Awesome Oscillator (AO) have broken above their mean levels of 50 and 0, respectively, suggesting strength in the market and supporting the bounce.
If bulls are more aggressive and the overall crypto market is bullish, DOGE could surge 20% higher to tag the $0.20 to $0.210 zone, which is a bearish order block. An order block is where market participants, such as institutional traders, have placed significant sell orders.
The RSI and AO both exceed the mean levels of 50 and 0, respectively. This indicates that the bullish momentum is back to being in control.
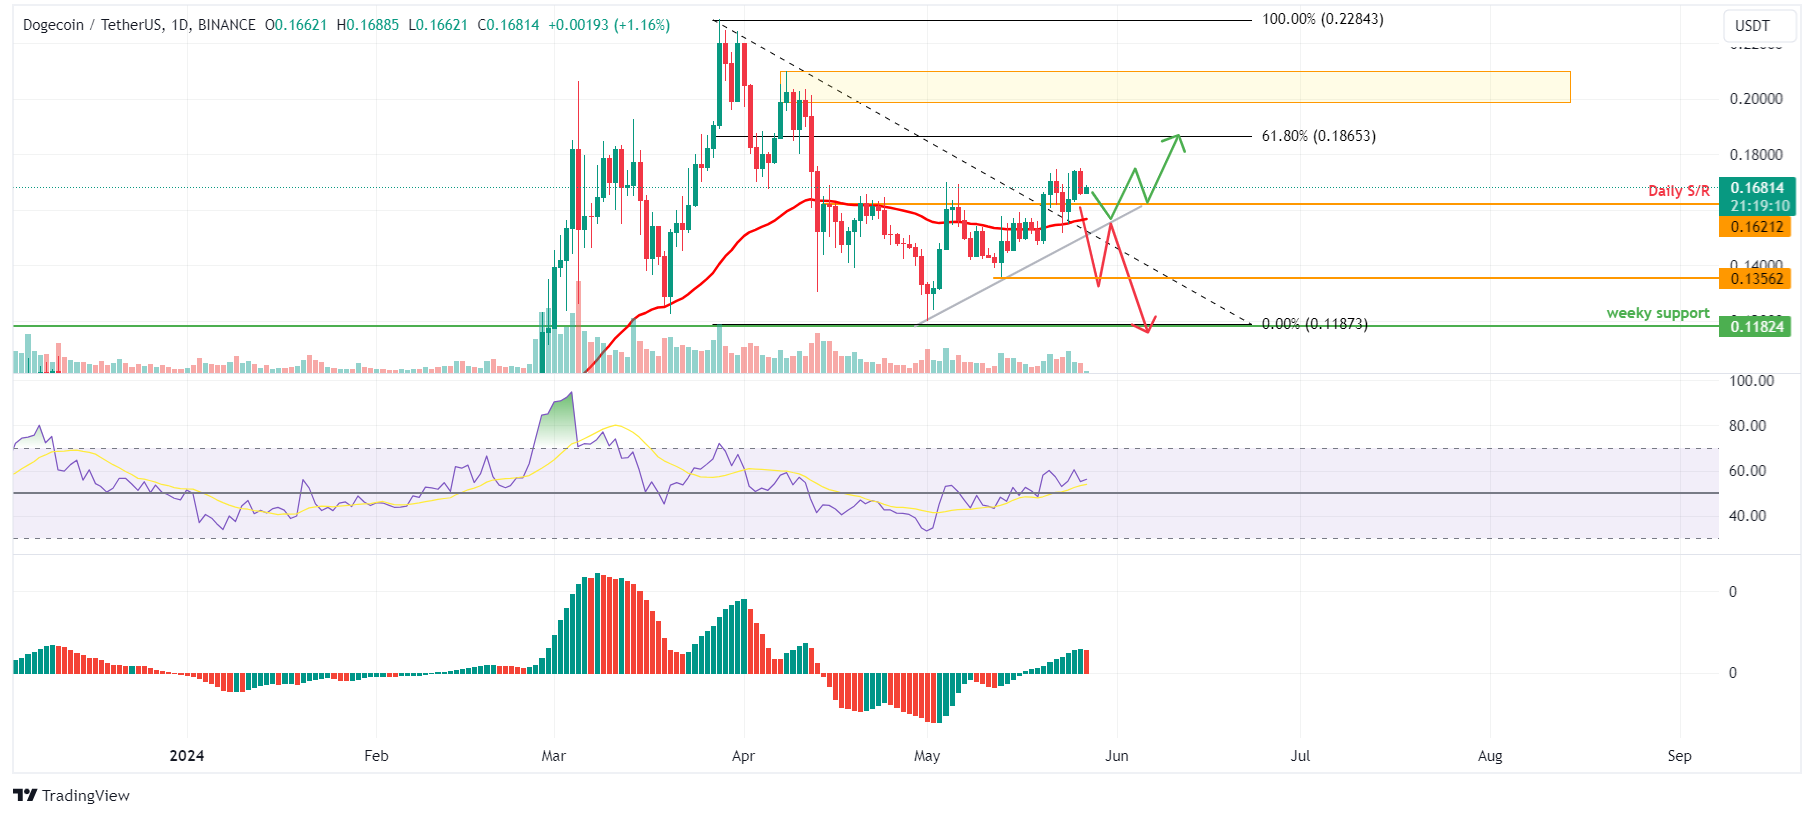
DOGE/USDT 1-day chart
Based on IntoTheBlock's In/Out of the Money Map (IOMAP), nearly 89,240 addresses accumulated 7 billion DOGE tokens. These addresses bought the DOGE token between $0.163 and $0.167, which makes it a key support zone. These investors will likely add more to their holdings if the price retraces.
The level $0.163 daily support zone mentioned for a technical analysis perfectly IOMAP findings, making a key reversal zone to watch.
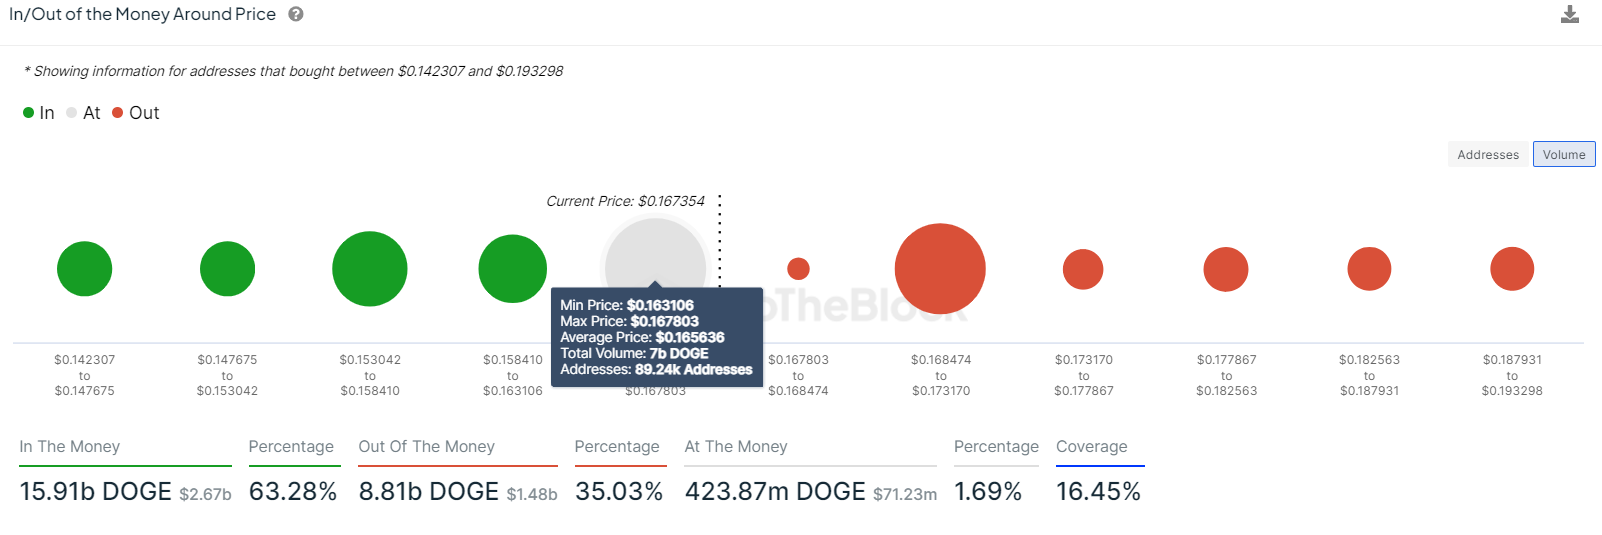
DOGE IOMAP chart
Despite strong technical analysis and on-chain data, if the DOGE daily candlestick closes below the $0.135 level, it will break the bullish trend line by setting up a lower low. This move could potentially trigger the Dogechain price to crash by 10% and retest the previous support level of $0.118.
Author

Manish Chhetri
FXStreet
Manish Chhetri is a crypto specialist with over four years of experience in the cryptocurrency industry.


