Ethereum withdrawals outpace deposits, alarming ETH holders of the price impact
- Ethereum newly staked in the ETH2 deposit contract has not outpaced the volume of ETH withdrawn.
- 306,000 Ether has been withdrawn while a little over 50% of this amount has been newly deposited to the Beacon chain contract.
- Experts predict a pullback in the altcoin before a run up to Ethereum’s $2,500 bullish target.

Ethereum staked in the ETH2 deposit contract post the Shapella upgrade is yet to exceed the volume of the altcoin withdrawn. Experts have noted that withdrawals are typically rewards, instead of full stake of validators, however the pace of withdrawals has alarmed the ETH community.
Also read: Ethereum price rally to $2,000 is fueled by these catalysts and macro moves
Ethereum deposits to ETH2 contract account for upwards of 50% of withdrawals
Ethereum holders rejoiced with the altcoin’s recent run up to the $2,100 level in response to the shifting macroeconomic outlook. However, the slow pace of deposits when compared to the withdrawal of rewards by validators has raised alarm among ETH holders.
Based on data from the Nansen AI chart below, the volume of ETH newly staked since April 12 is 160,000 Ether, against 306,000 ETH in withdrawals from the Beacon contract.
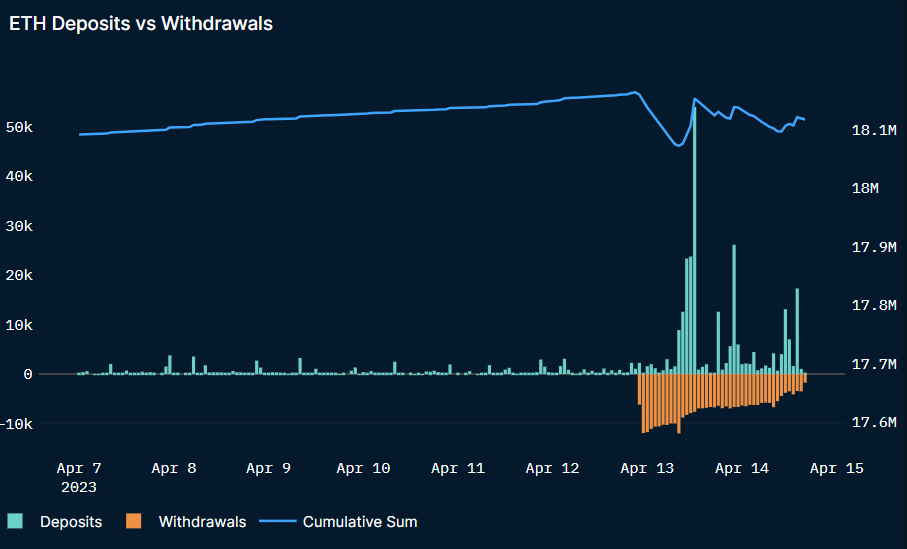
ETH deposits v. withdrawals
Experts have noted that the statistics should not be considered a cause of alarm since the withdrawals typically consist of partial withdrawals, and not the full balance of the 32 ETH staked. The above chart therefore does not represent unstaking validators in the Ethereum network.
Will Ethereum withdrawals trigger a pullback in ETH price?
Ethereum price rallied to $2,100 in a swift move before the pullback to the $2,000 level, based on CoinGecko data. There is a likelihood of validators selling their unstaked rewards and this could increase the selling pressure on the altcoin in the short-term.
Ethereum price could experience a pullback before another leg up, in the ongoing bull market.
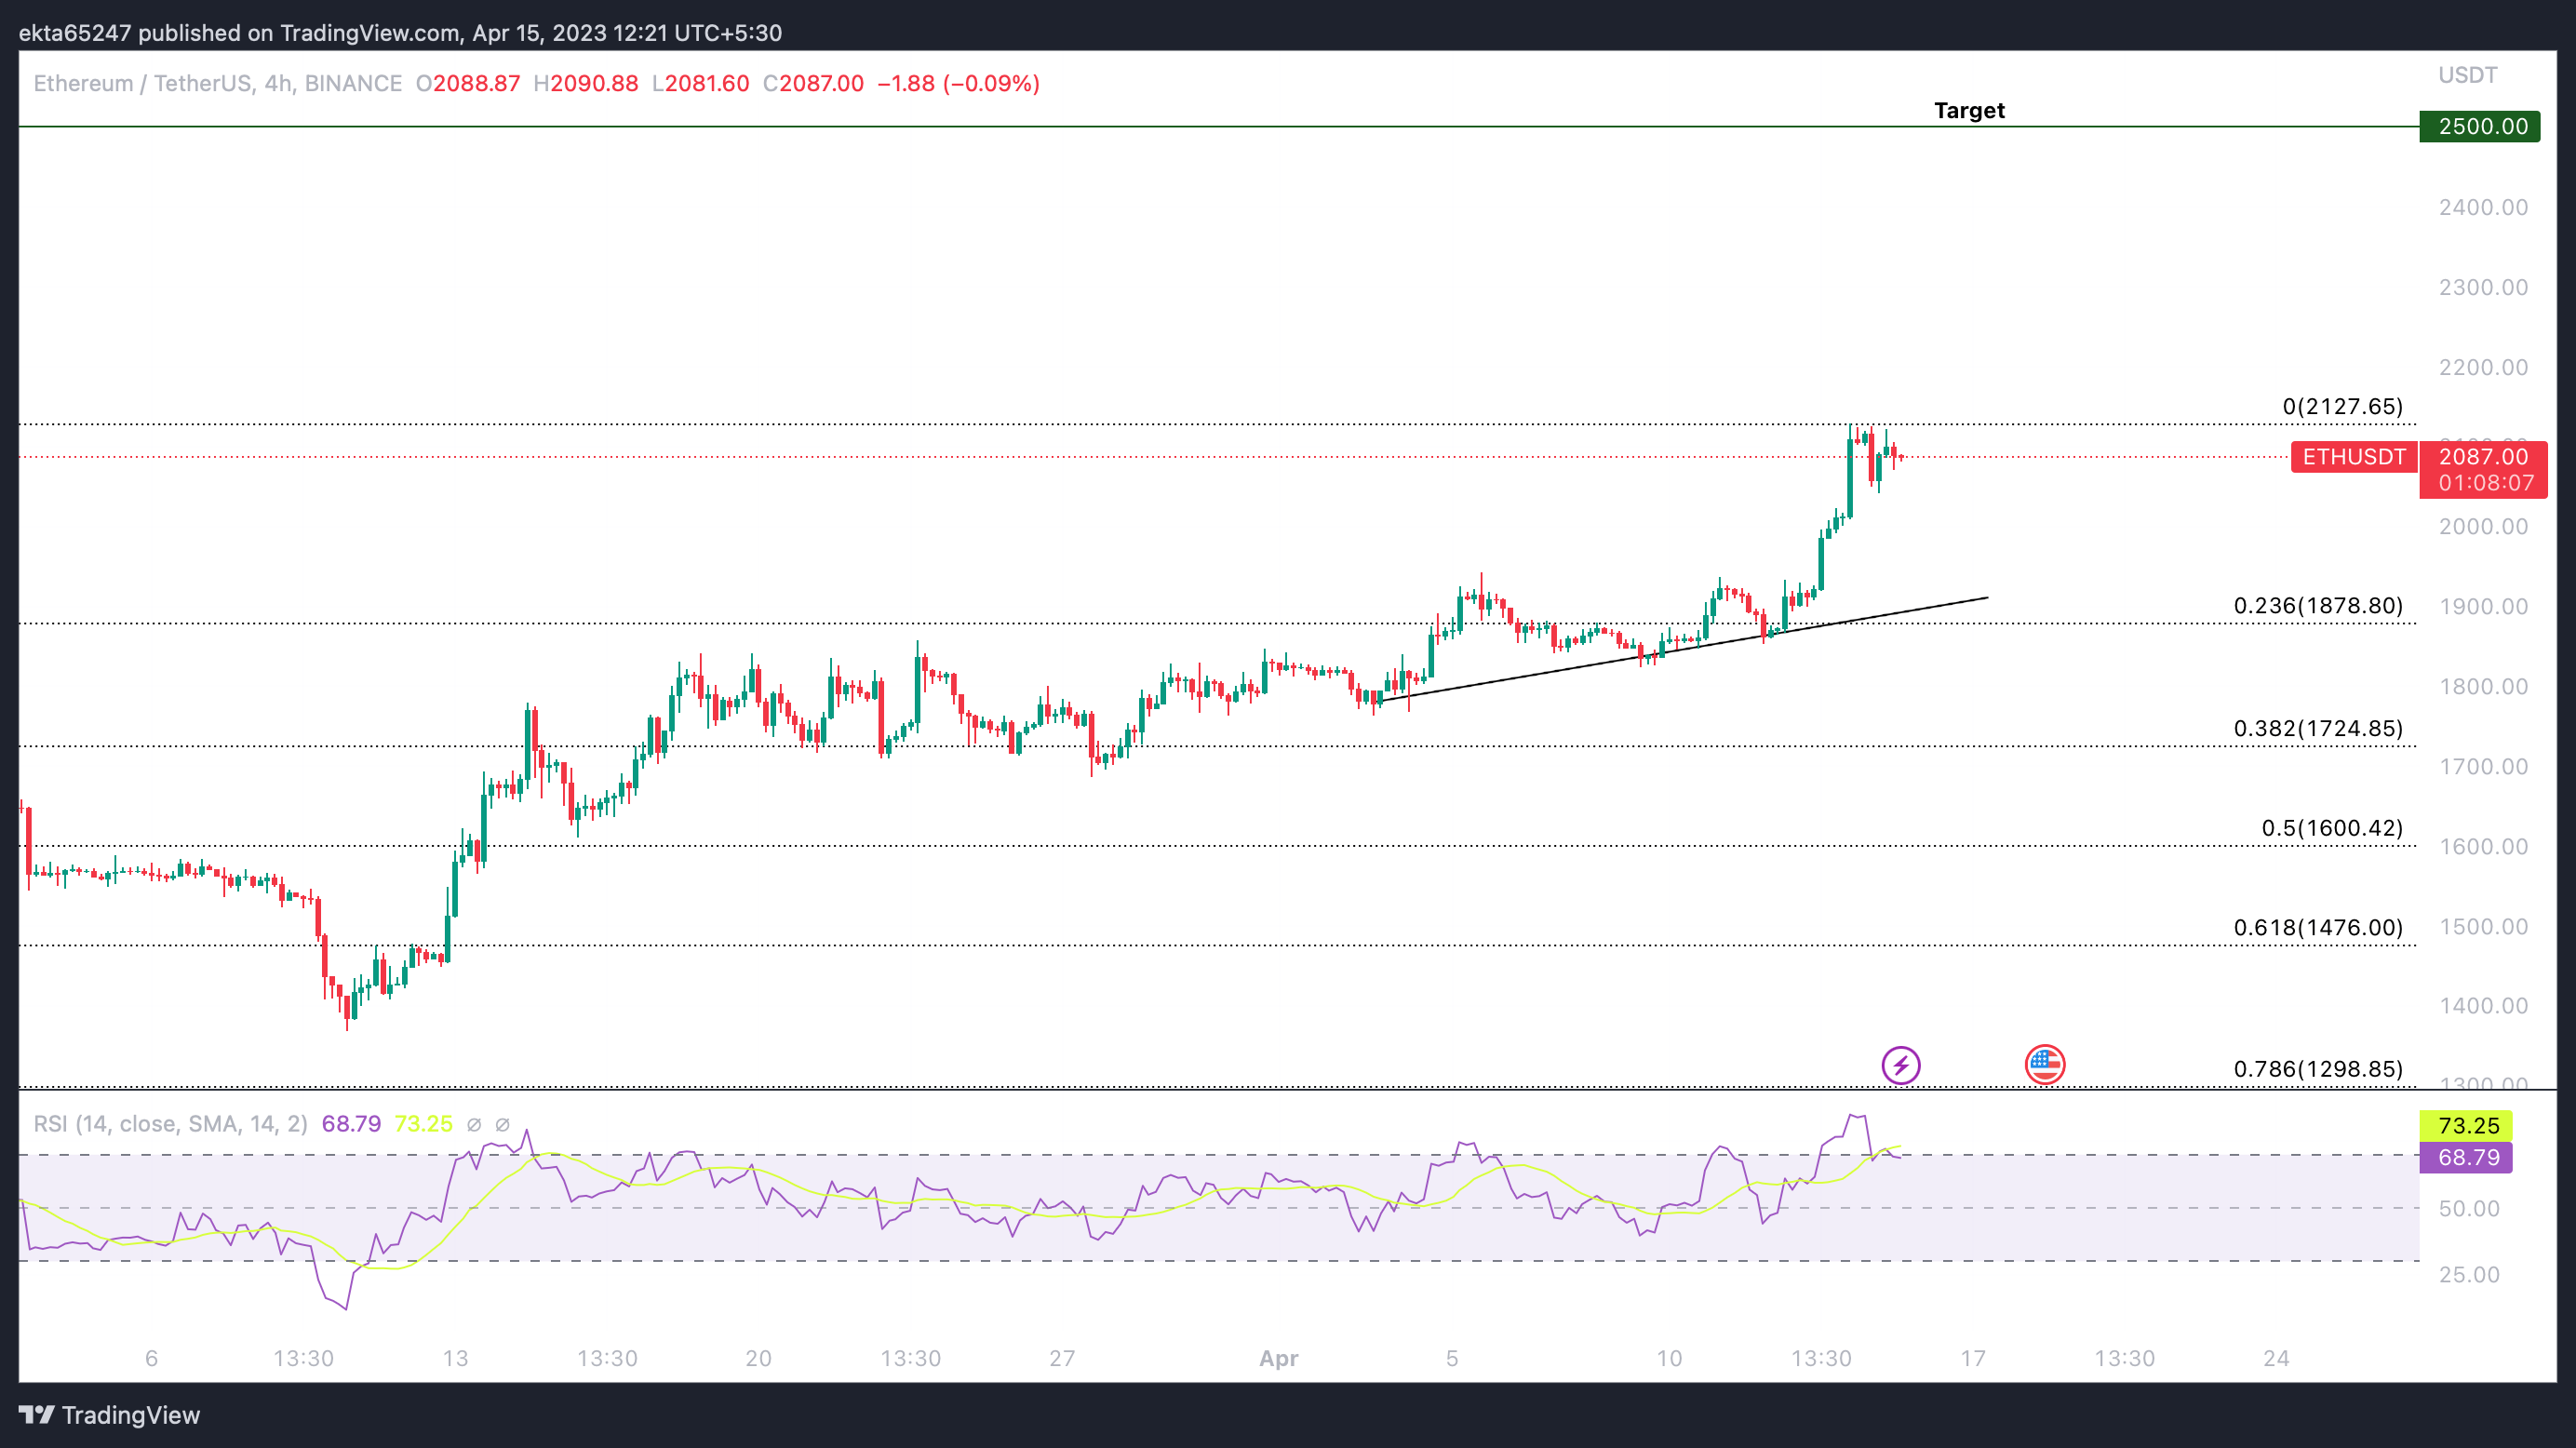
ETH/USDT 4H price chart
Ethereum price is in a short-term uptrend, after hitting its peak of $2,1000, the asset retraced to the support at $2,000. If ETH price continues to decline, next support is at the 23.6% Fibonacci Retracement at $1,878.
If Ethereum price climbs above the $2,100 level, it could invalidate the bearish thesis. Crypto_McKenna, a crypto analyst and trader has predicted a run up to $2,445 and the next bullish target for the altcoin is the $3,411 level. The expert identified a series of supports between $1,600 and $2,000 for the altcoin, as seen in the chart below.
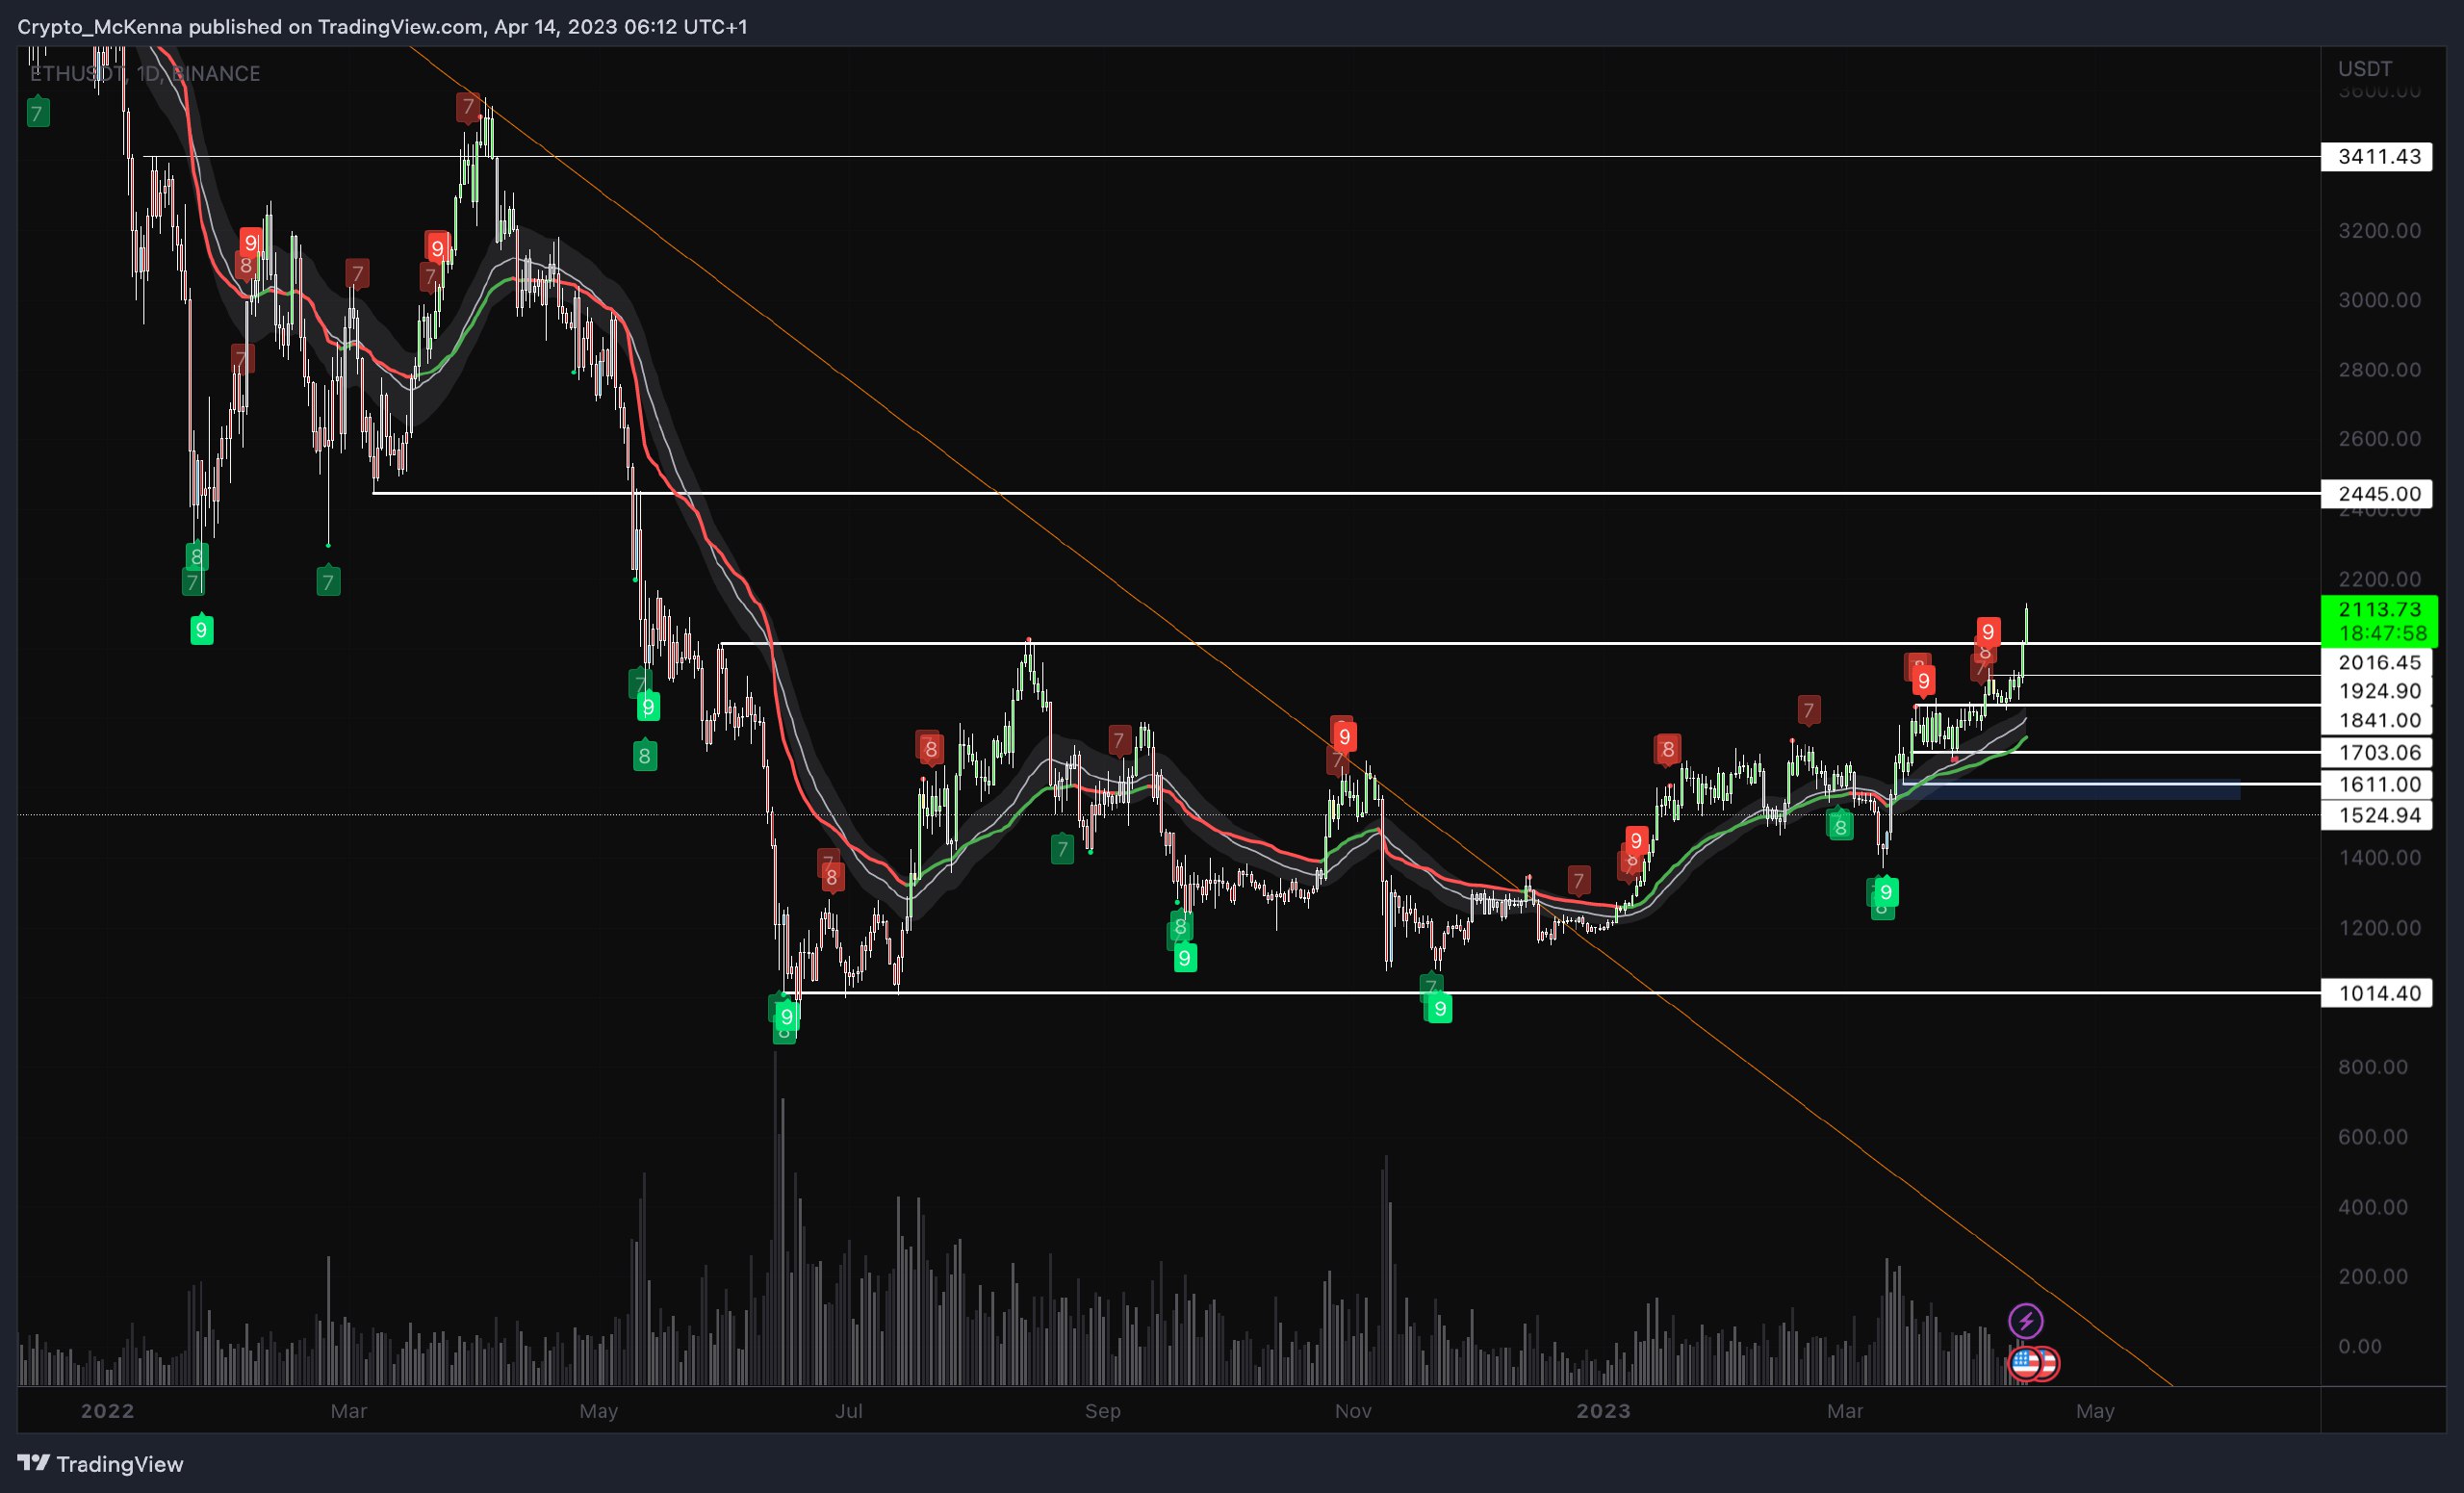
ETH/USD 1D price chart
Once Ethereum price crosses key resistance at $2,445, the analyst predicts an explosive move to $3,411.
Author

Ekta Mourya
FXStreet
Ekta Mourya has extensive experience in fundamental and on-chain analysis, particularly focused on impact of macroeconomics and central bank policies on cryptocurrencies.


