Ethereum transaction volume surges to four month peak as ETH price risks decline to $2,000
- Ethereum noted a massive surge in transaction volume on Thursday, at a four-month peak of 4.37 million.
- Ethereum whales are engaged in profit-taking and Ether is at risk of correcting lower.
- ETH price could nosedive to its psychologically important level of $2,000, in the event of a sell-off.

Ethereum transaction volume noted a surge on January 25, according to Santiment data. This increase in transactions indicates that there was a large volume exchange of Ether between market participants on exchange platforms. Typically this can be a bullish or bearish indicator depending on whether traders are realizing profits or losses, and the asset’s price trend.
At the time of writing, Ethereum price is $2,217.
Also read: Ethereum traders realize nearly $33 million in losses as overheated futures market cools
Ethereum on-chain metrics signal risk of price decline
Ethereum’s on-chain metric, Transaction Volume, has hit a four-month peak on January 25. Santiment data reveals that there was a surge in transactions as market participants witnessed large volume transfers by institutions like bankrupt crypto lender Celsius.
 [10.51.02, 26 Jan, 2024]-638418532798097809.png)
Ethereum Transaction Volume. Source: Santiment
Large wallet addresses in the Ethereum network have engaged in profit-taking, as seen in the chart below. When the Whale Transaction Count, valued at $100,000 and higher, is combined with Network Realized Profit/Loss, the data reveals that whales are realizing profits.
Santiment data therefore supports the likelihood of a correction in ETH price.
 [10.53.37, 26 Jan, 2024]-638418533301301005.png)
Whale Transaction Count and Network Realized Profit/ Loss. Source: Santiment
Ethereum price at risk of decline
Ethereum price is in a downward trend that started on January 12. Since then, the altcoin has formed lower highs and lower lows, and broken below a key trendline. Ethereum price is currently below two key Exponential Moving Averages (EMAs), the 10-day and 50-day, at $2,325, and $2,308.
If Ethereum price continues correcting, it is likely to find support at $2,165, a level that has acted as support for the altcoin since December 3. If ETH price fails to hold above this level, the altcoin could nosedive to its psychologically important level of $2,000, as seen in the chart below.
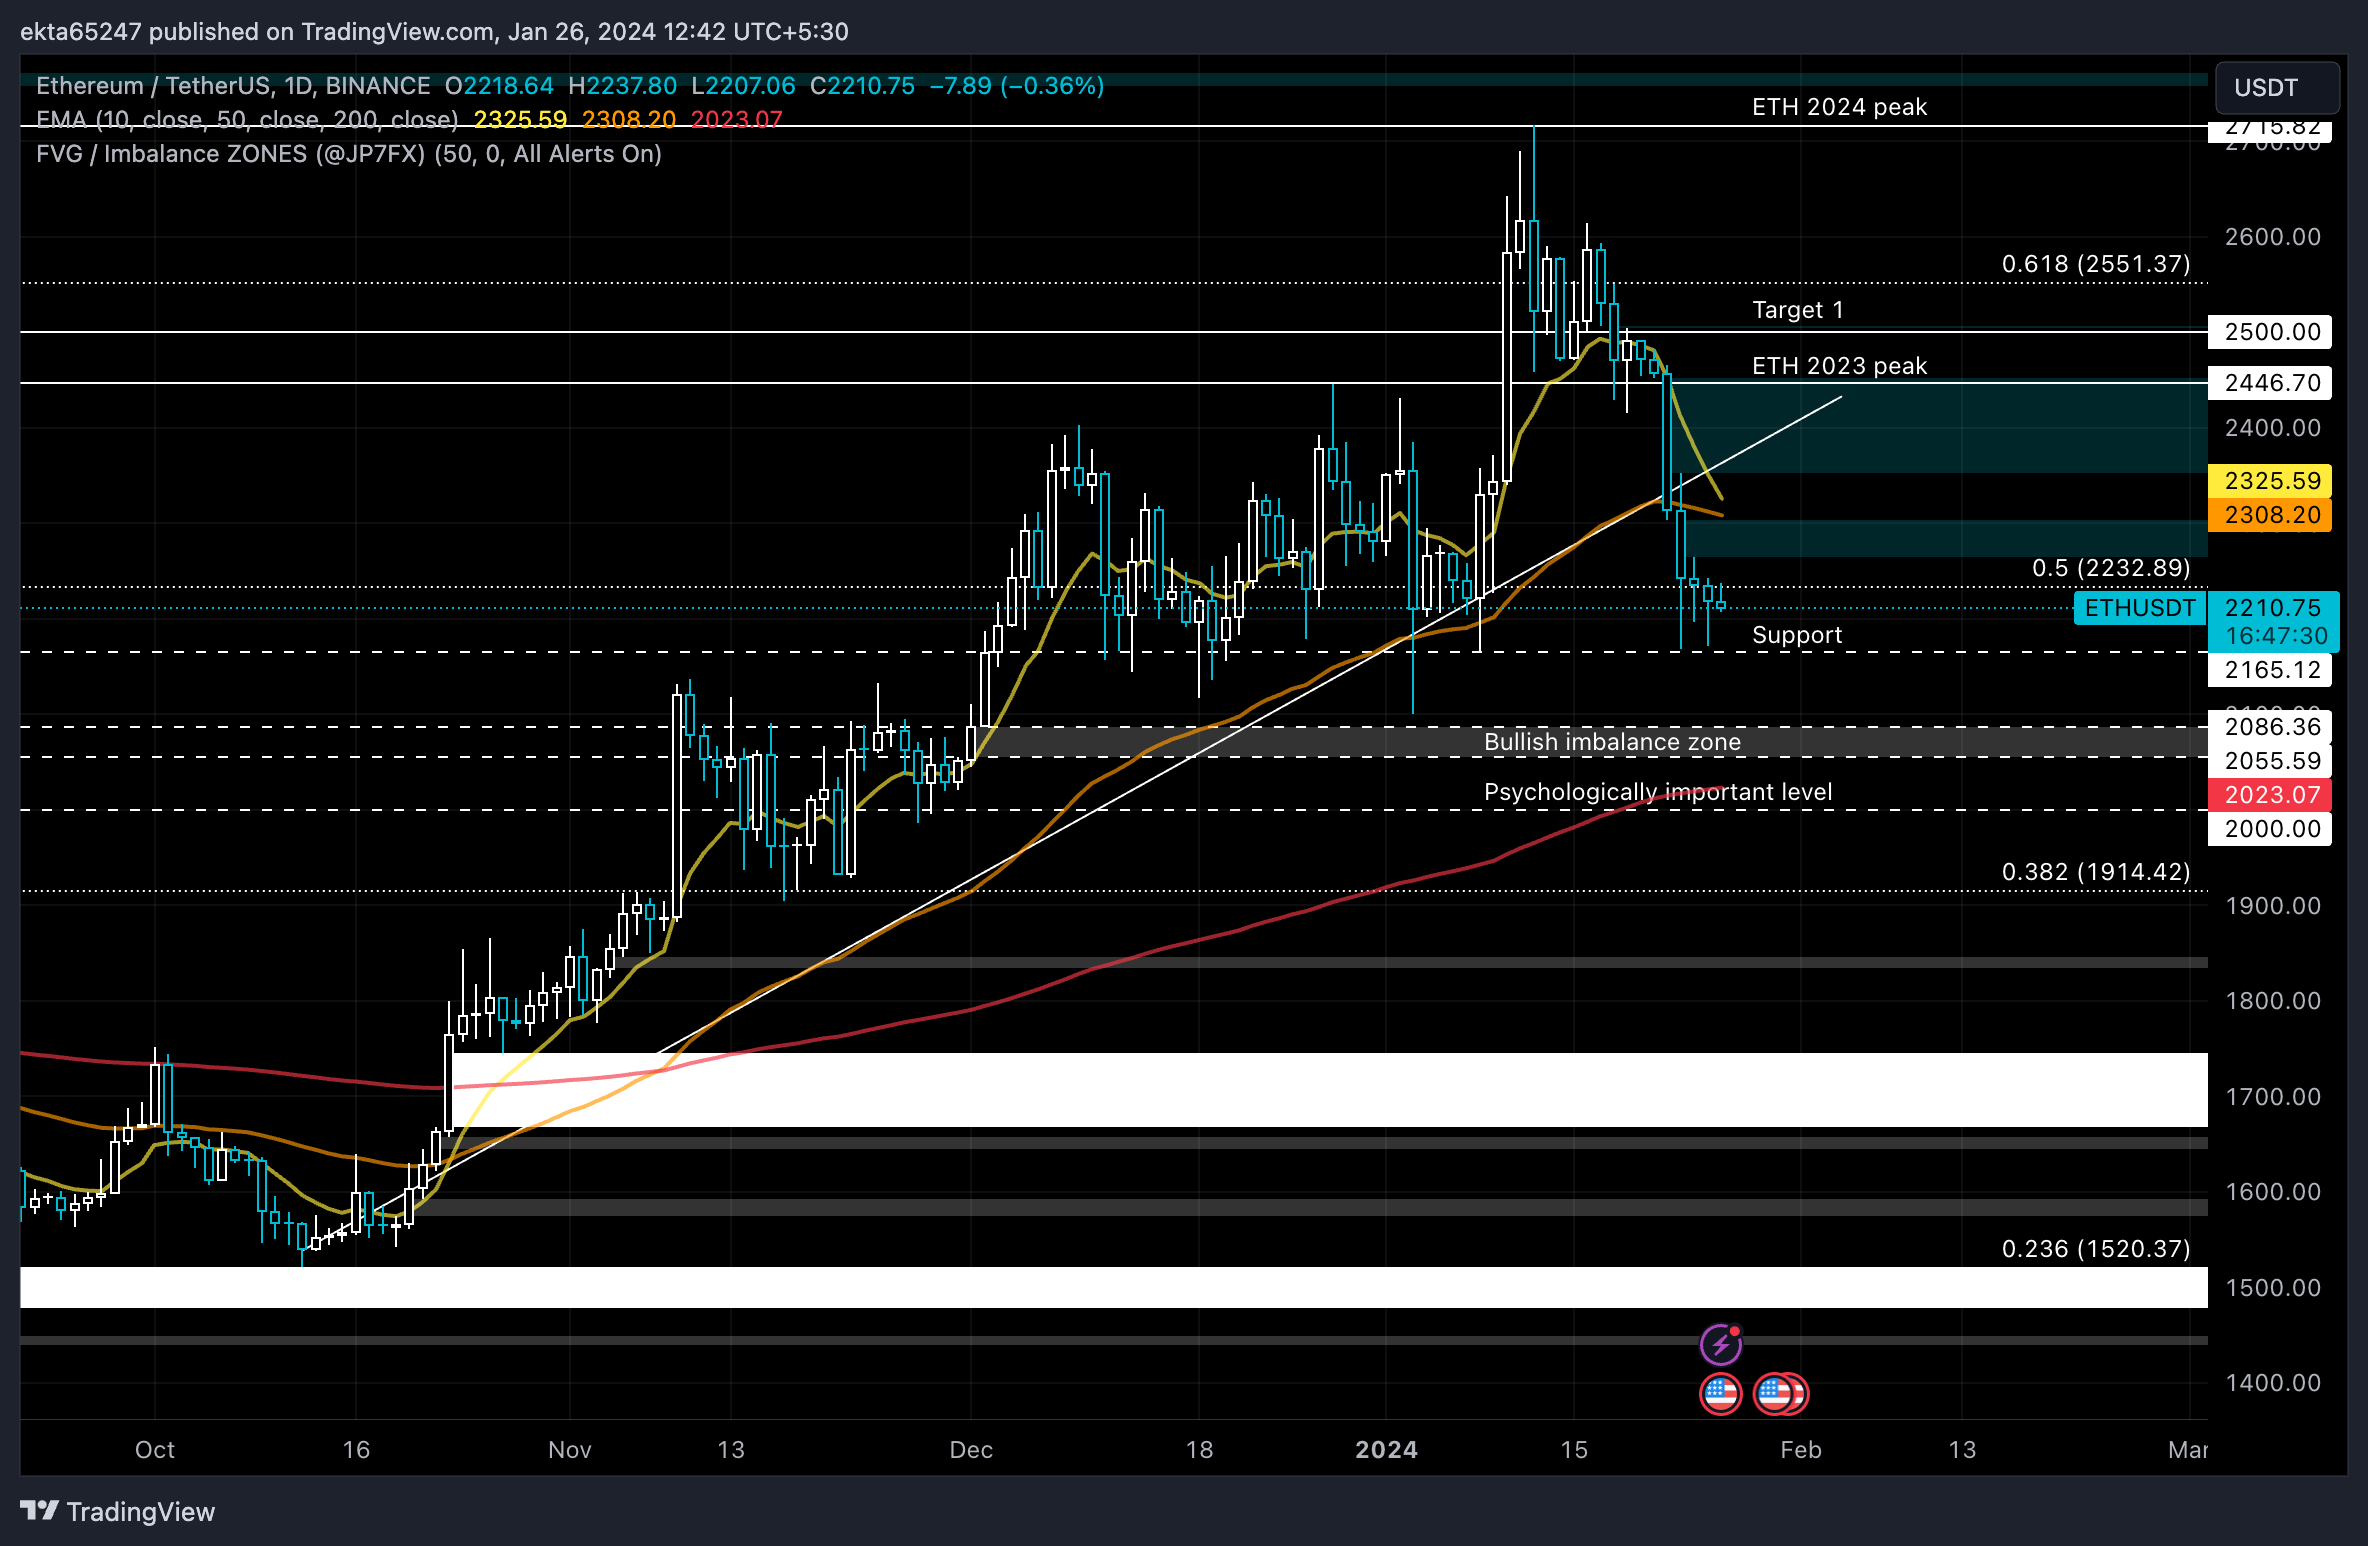
ETH/USDT 1-day chart
A daily candlestick close above the $2,232 level could invalidate the bearish thesis for Ethereum price.
Author

Ekta Mourya
FXStreet
Ekta Mourya has extensive experience in fundamental and on-chain analysis, particularly focused on impact of macroeconomics and central bank policies on cryptocurrencies.




