Ethereum price rally to $2,000 likely fueled by this developmental catalyst in ETH
- Ethereum network’s developers completed their consensus call, discussing the progress of three key Ethereum Improvement Proposals.
- The EIPs are focused on improving the Ethereum blockchain for liquid staking protocols and enhancing the security of Ether.
- ETH price tested resistance at $2,000 earlier today and experts noted that institutions are lining up to buy Ether.

Ethereum price climbed to key resistance at $2,000 on May 6. Ethereum blockchain’s developers recently discussed Ethereum Improvement Proposals (EIPs) to include in future upgrades and boost scalability of the ETH blockchain.
Also read: Ethereum active deposits explode, wiping out decline from the FTX collapse
Ethereum price rally catalysts
Ethereum, the second-largest cryptocurrency by market capitalization, recently witnessed an eight-month peak in deposits to its ETH2 Beacon Chain contract. An increase in the volume of Ether deposited to the contract implied a reduction in the altcoin circulating supply. Coupled with the recent consensus call of ETH developers, these updates have acted as bullish catalysts for Ether.
Ethereum network’s developers concluded their consensus call #108, where the focus was on three key Ethereum Improvement Proposals (EIPs), EIP 4788, EIP 6987, and EIP 6475. The three EIPs will improve the blockchain for liquid staking protocols and boost the security of Ethereum.
EIP 4788 is useful for liquid staking protocols that want to prove new balance updates for their validators. EIP 6987 will prohibit penalized nodes from being elected as block proposers on Ether network and EIP-6475 boosts the compatibility of the network.
ETH tests resistance at $2,000, what’s next
Ethereum price is currently in an uptrend, climbing towards the bullish target of $2,500. ETH tested resistance at $2,000 today before correcting lower. ETH price is currently above three Exponential Moving Averages at 10, 50 and 200-day. Immediate support is at $1,912, the 38.2% Fibonacci level.
ETH price could face immediate resistance at $2,104, a level that has acted as resistance for nearly ten months. The next key resistances are the 50% Fibonacci level at $2,231 and $2,341, that acted as support during Ethereum’s run up to $3,500 in mid-2022.
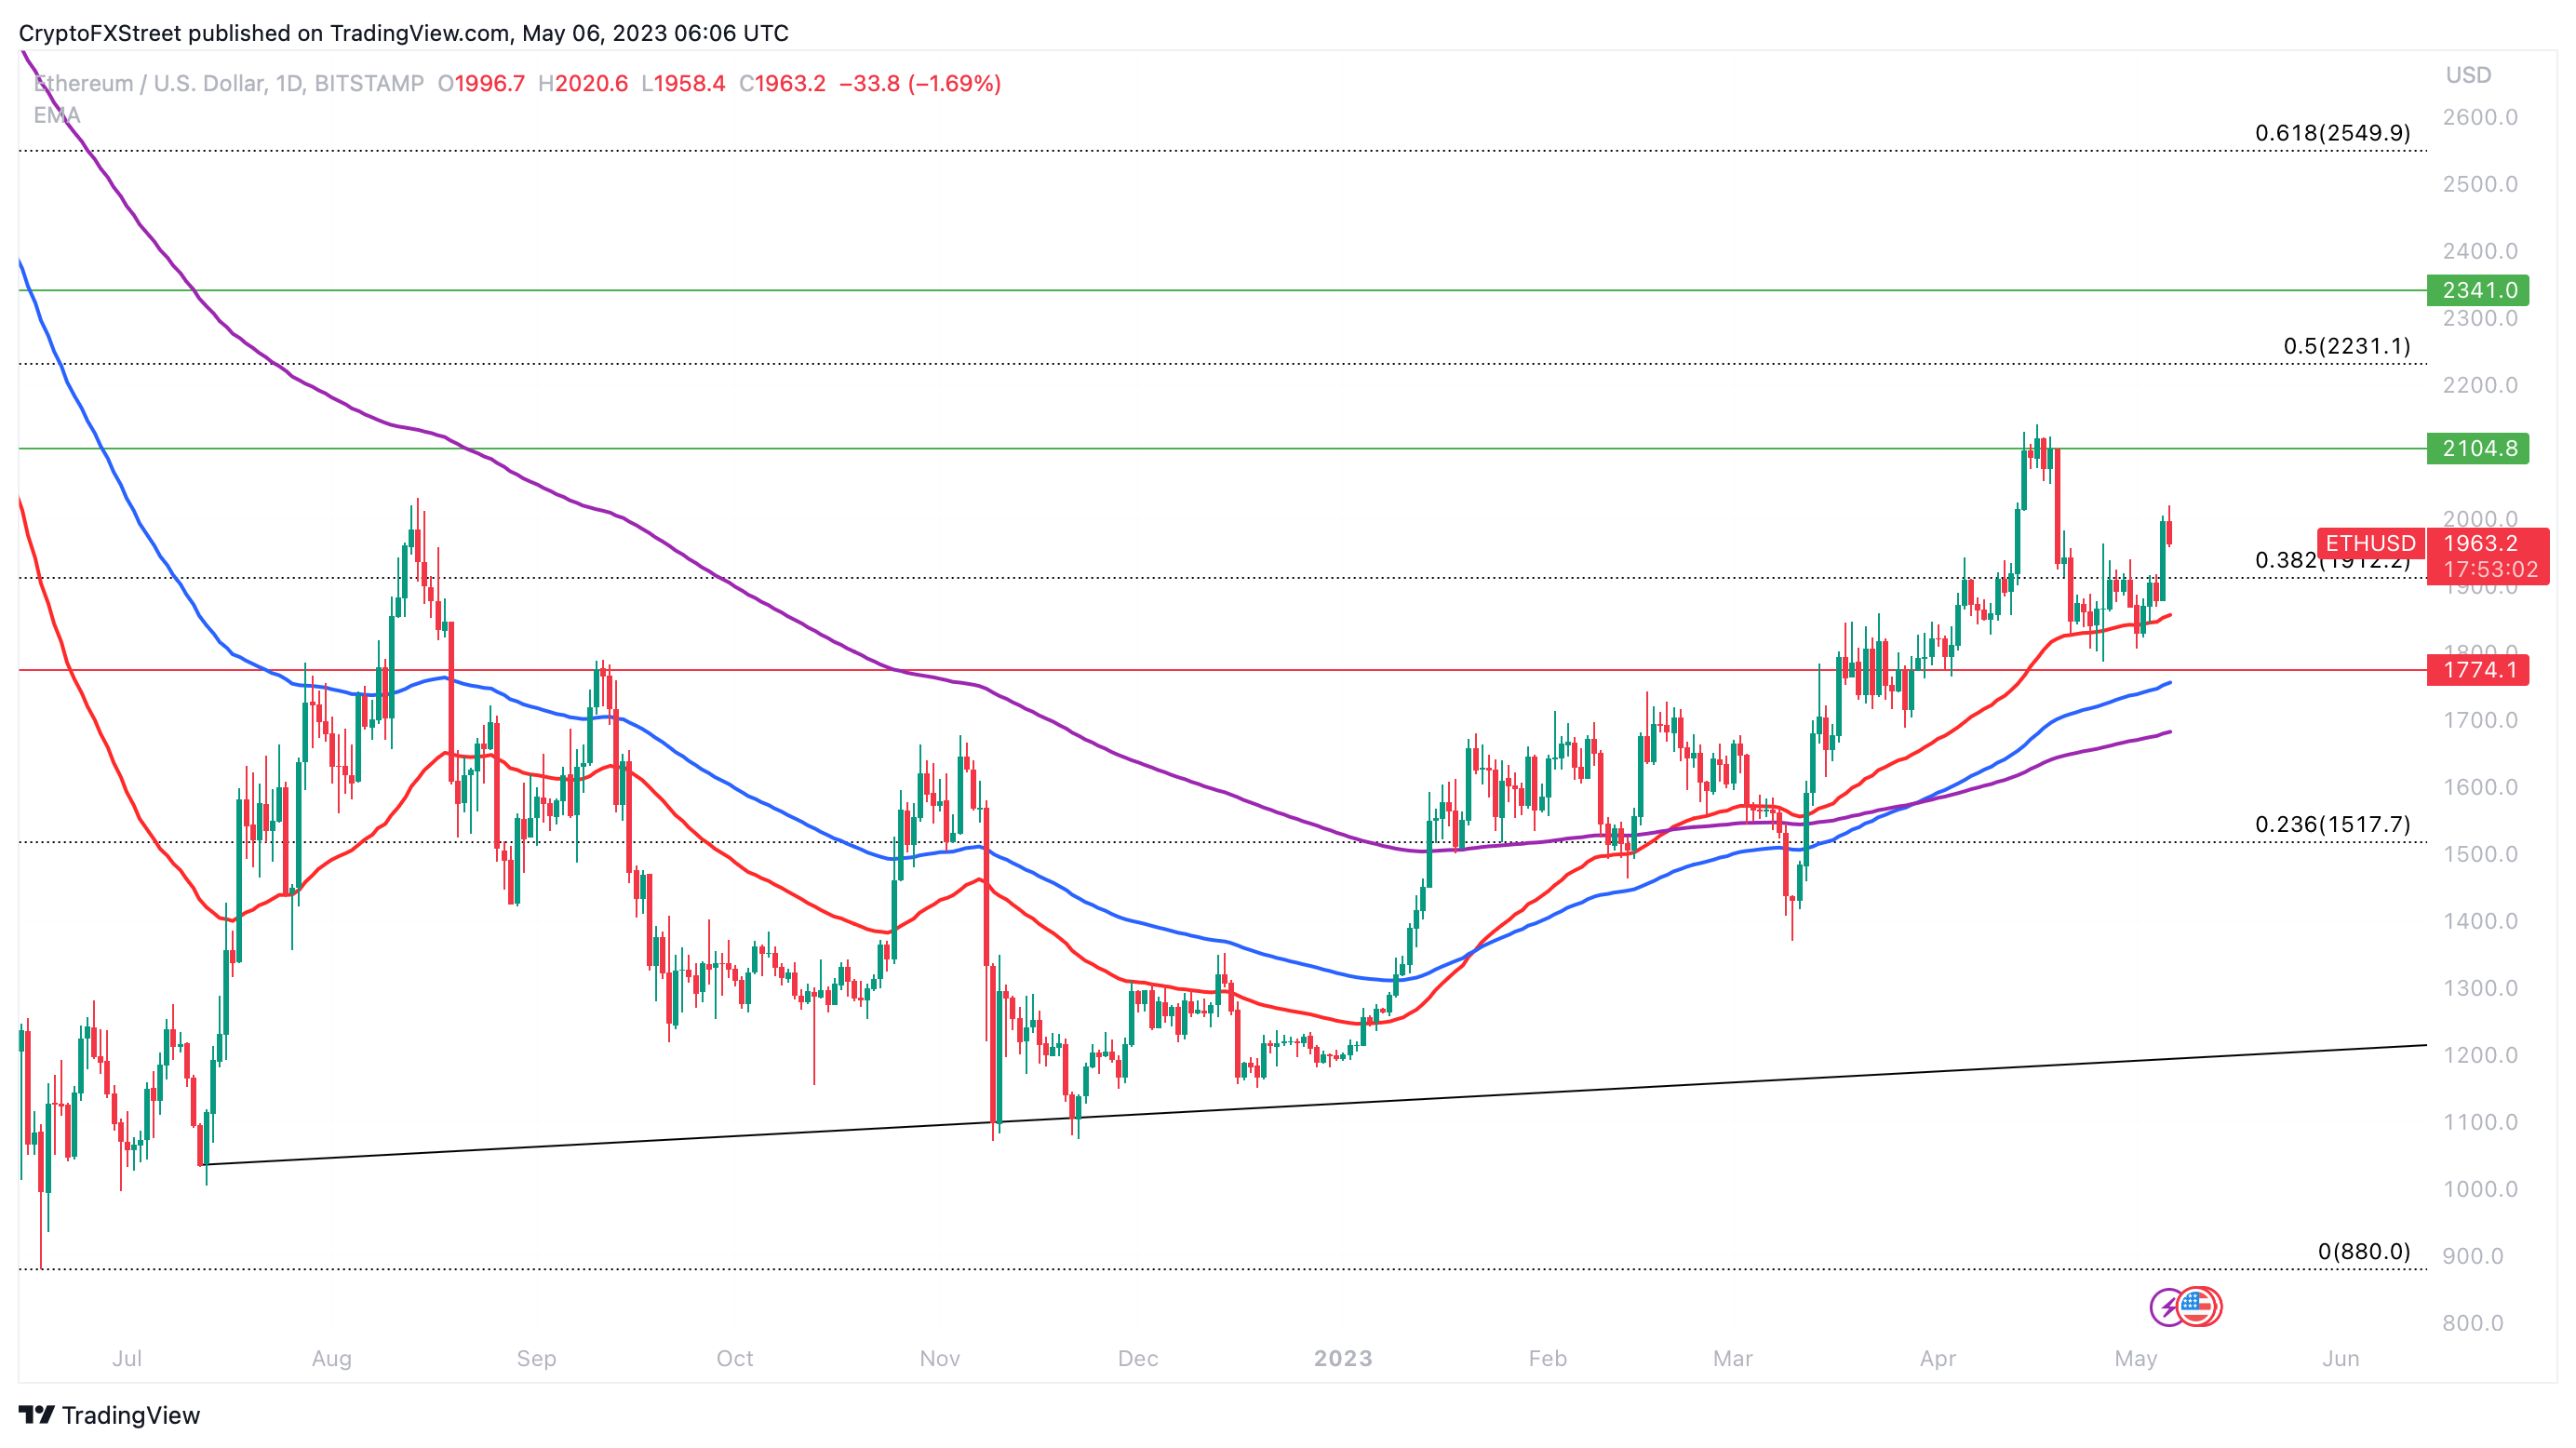
ETH/USD 1D price chart
A decline below key support at $1,774 could invalidate the bullish thesis for Ethereum. Three EMAs and the 23.6% Fibonacci level of $1,517 could act as support for the asset in the event of a decline.
Analysts at TradingAlpha.io evaluated the ETH/USD price chart and noted institutional buying, represented by an orange thrust candle in the chart below. When ETH price crossed $1,952, institutions lined up to scoop up the altcoin, according to the experts.
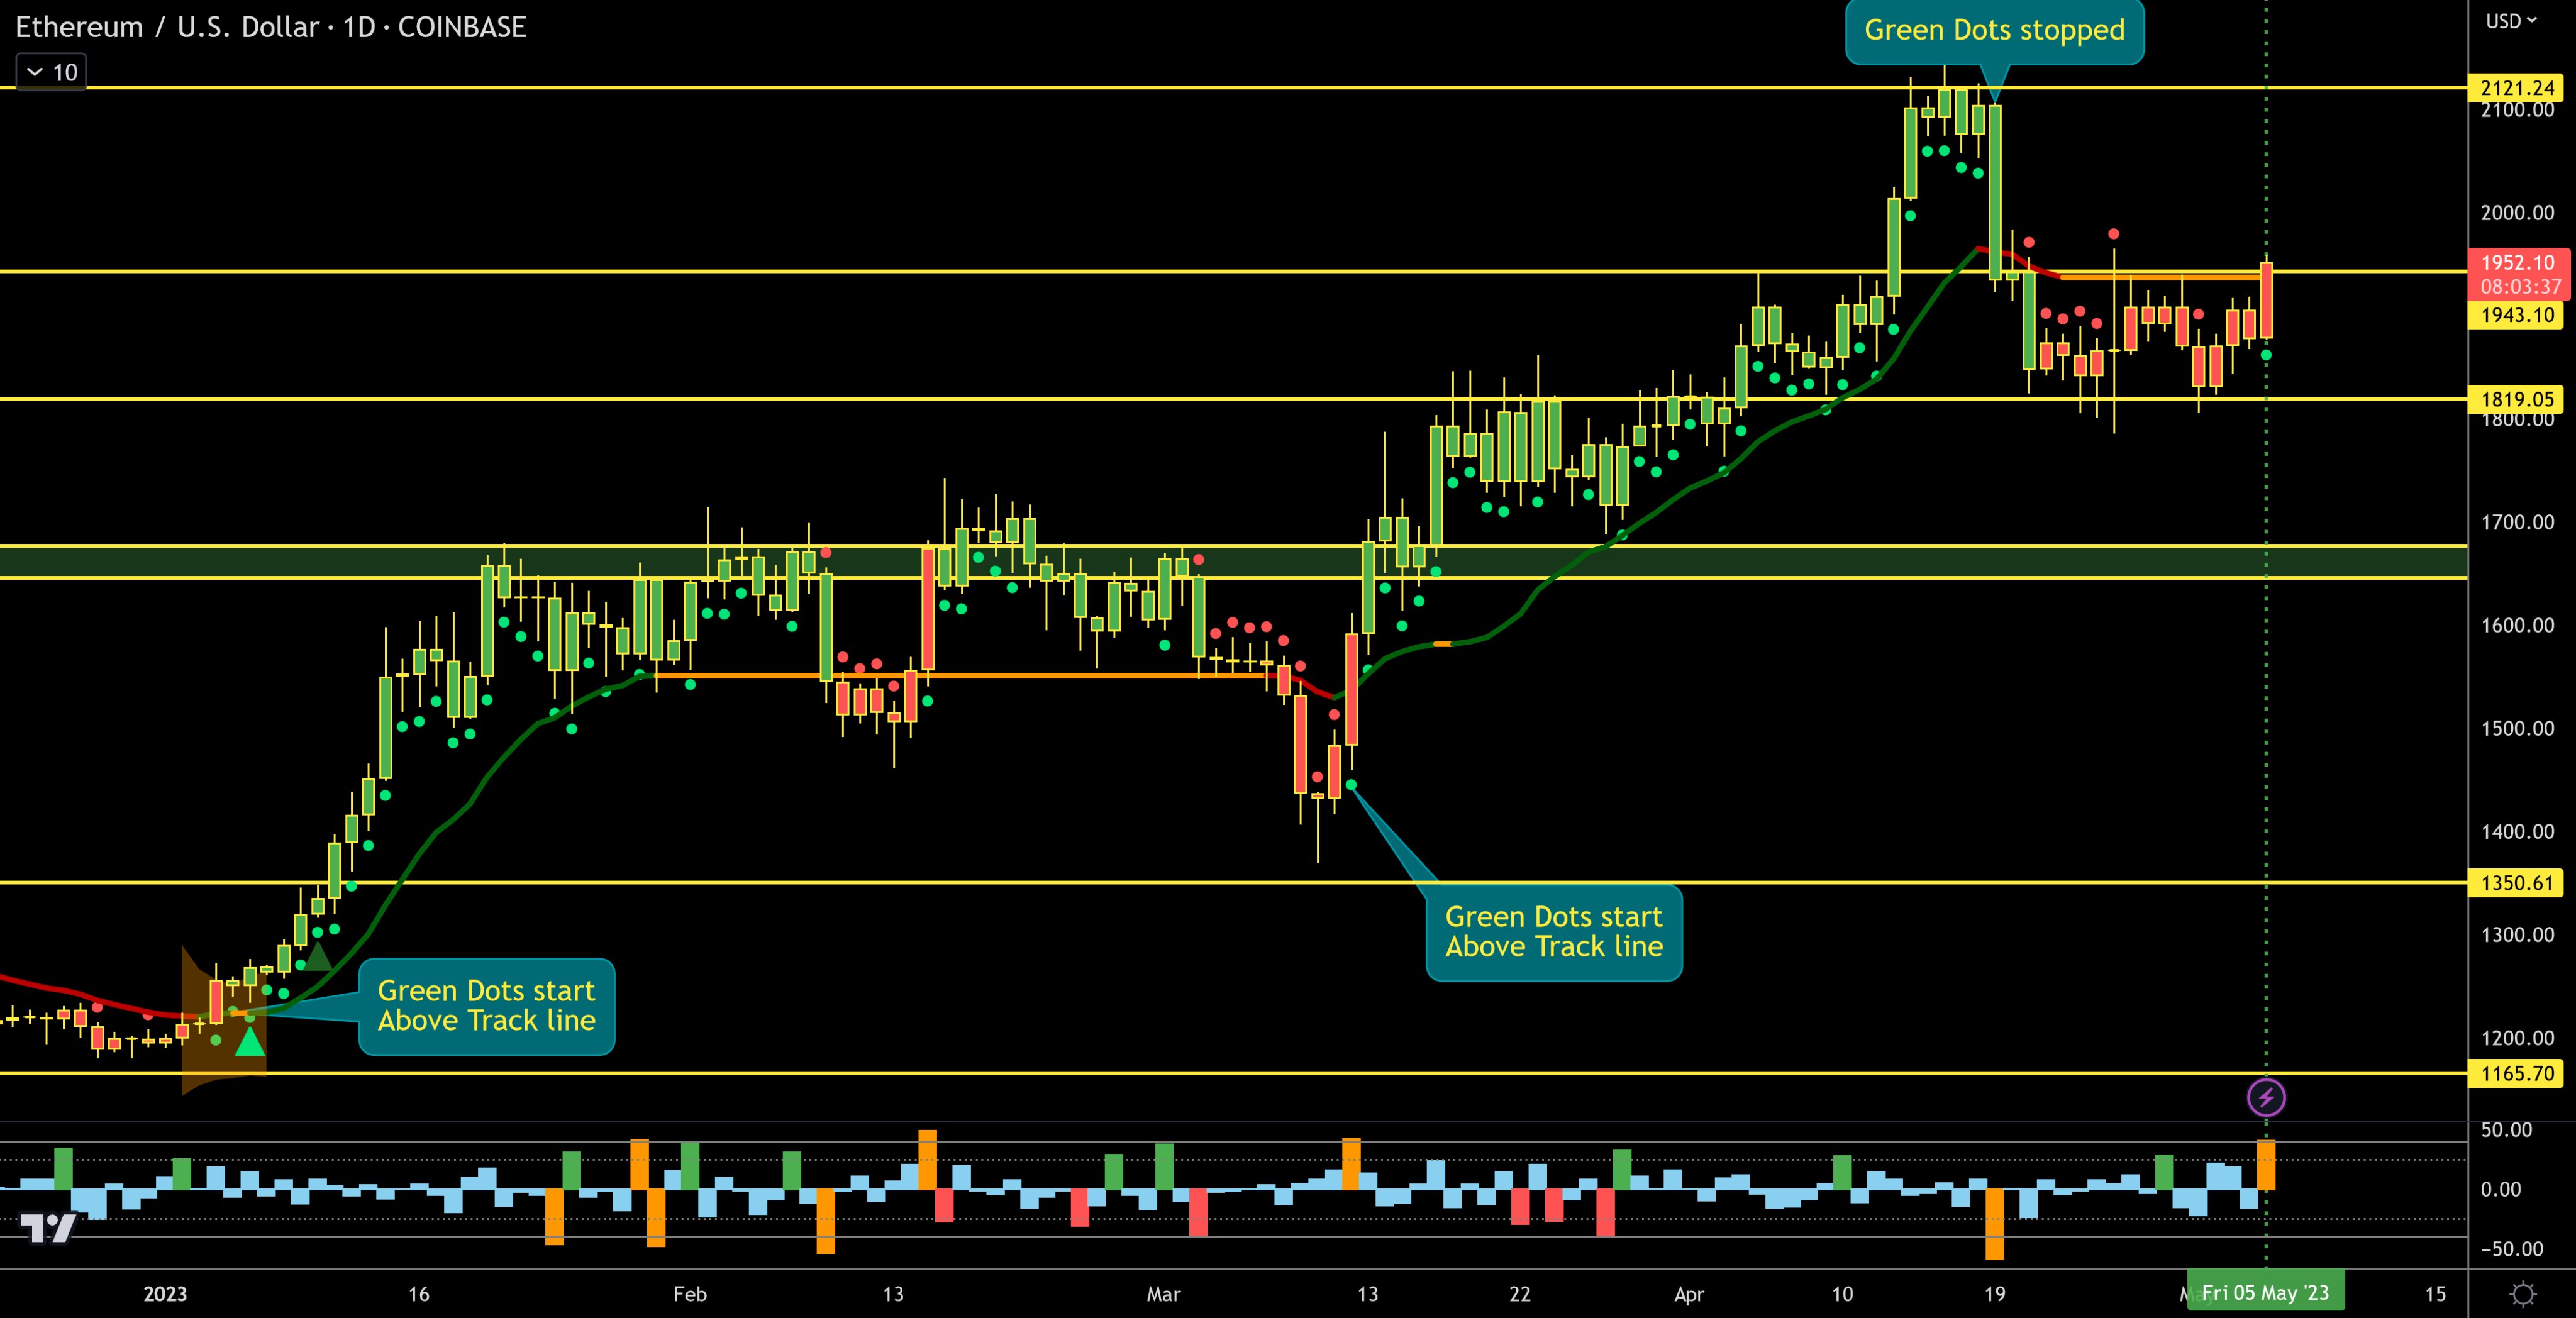
ETH/USD 1D price chart
Typically, institutional buying is a bullish sign for Ethereum and hints at a prolonged upward trend in the altcoin.
Author

Ekta Mourya
FXStreet
Ekta Mourya has extensive experience in fundamental and on-chain analysis, particularly focused on impact of macroeconomics and central bank policies on cryptocurrencies.


