Ethereum active deposits explode, wiping out decline from the FTX collapse
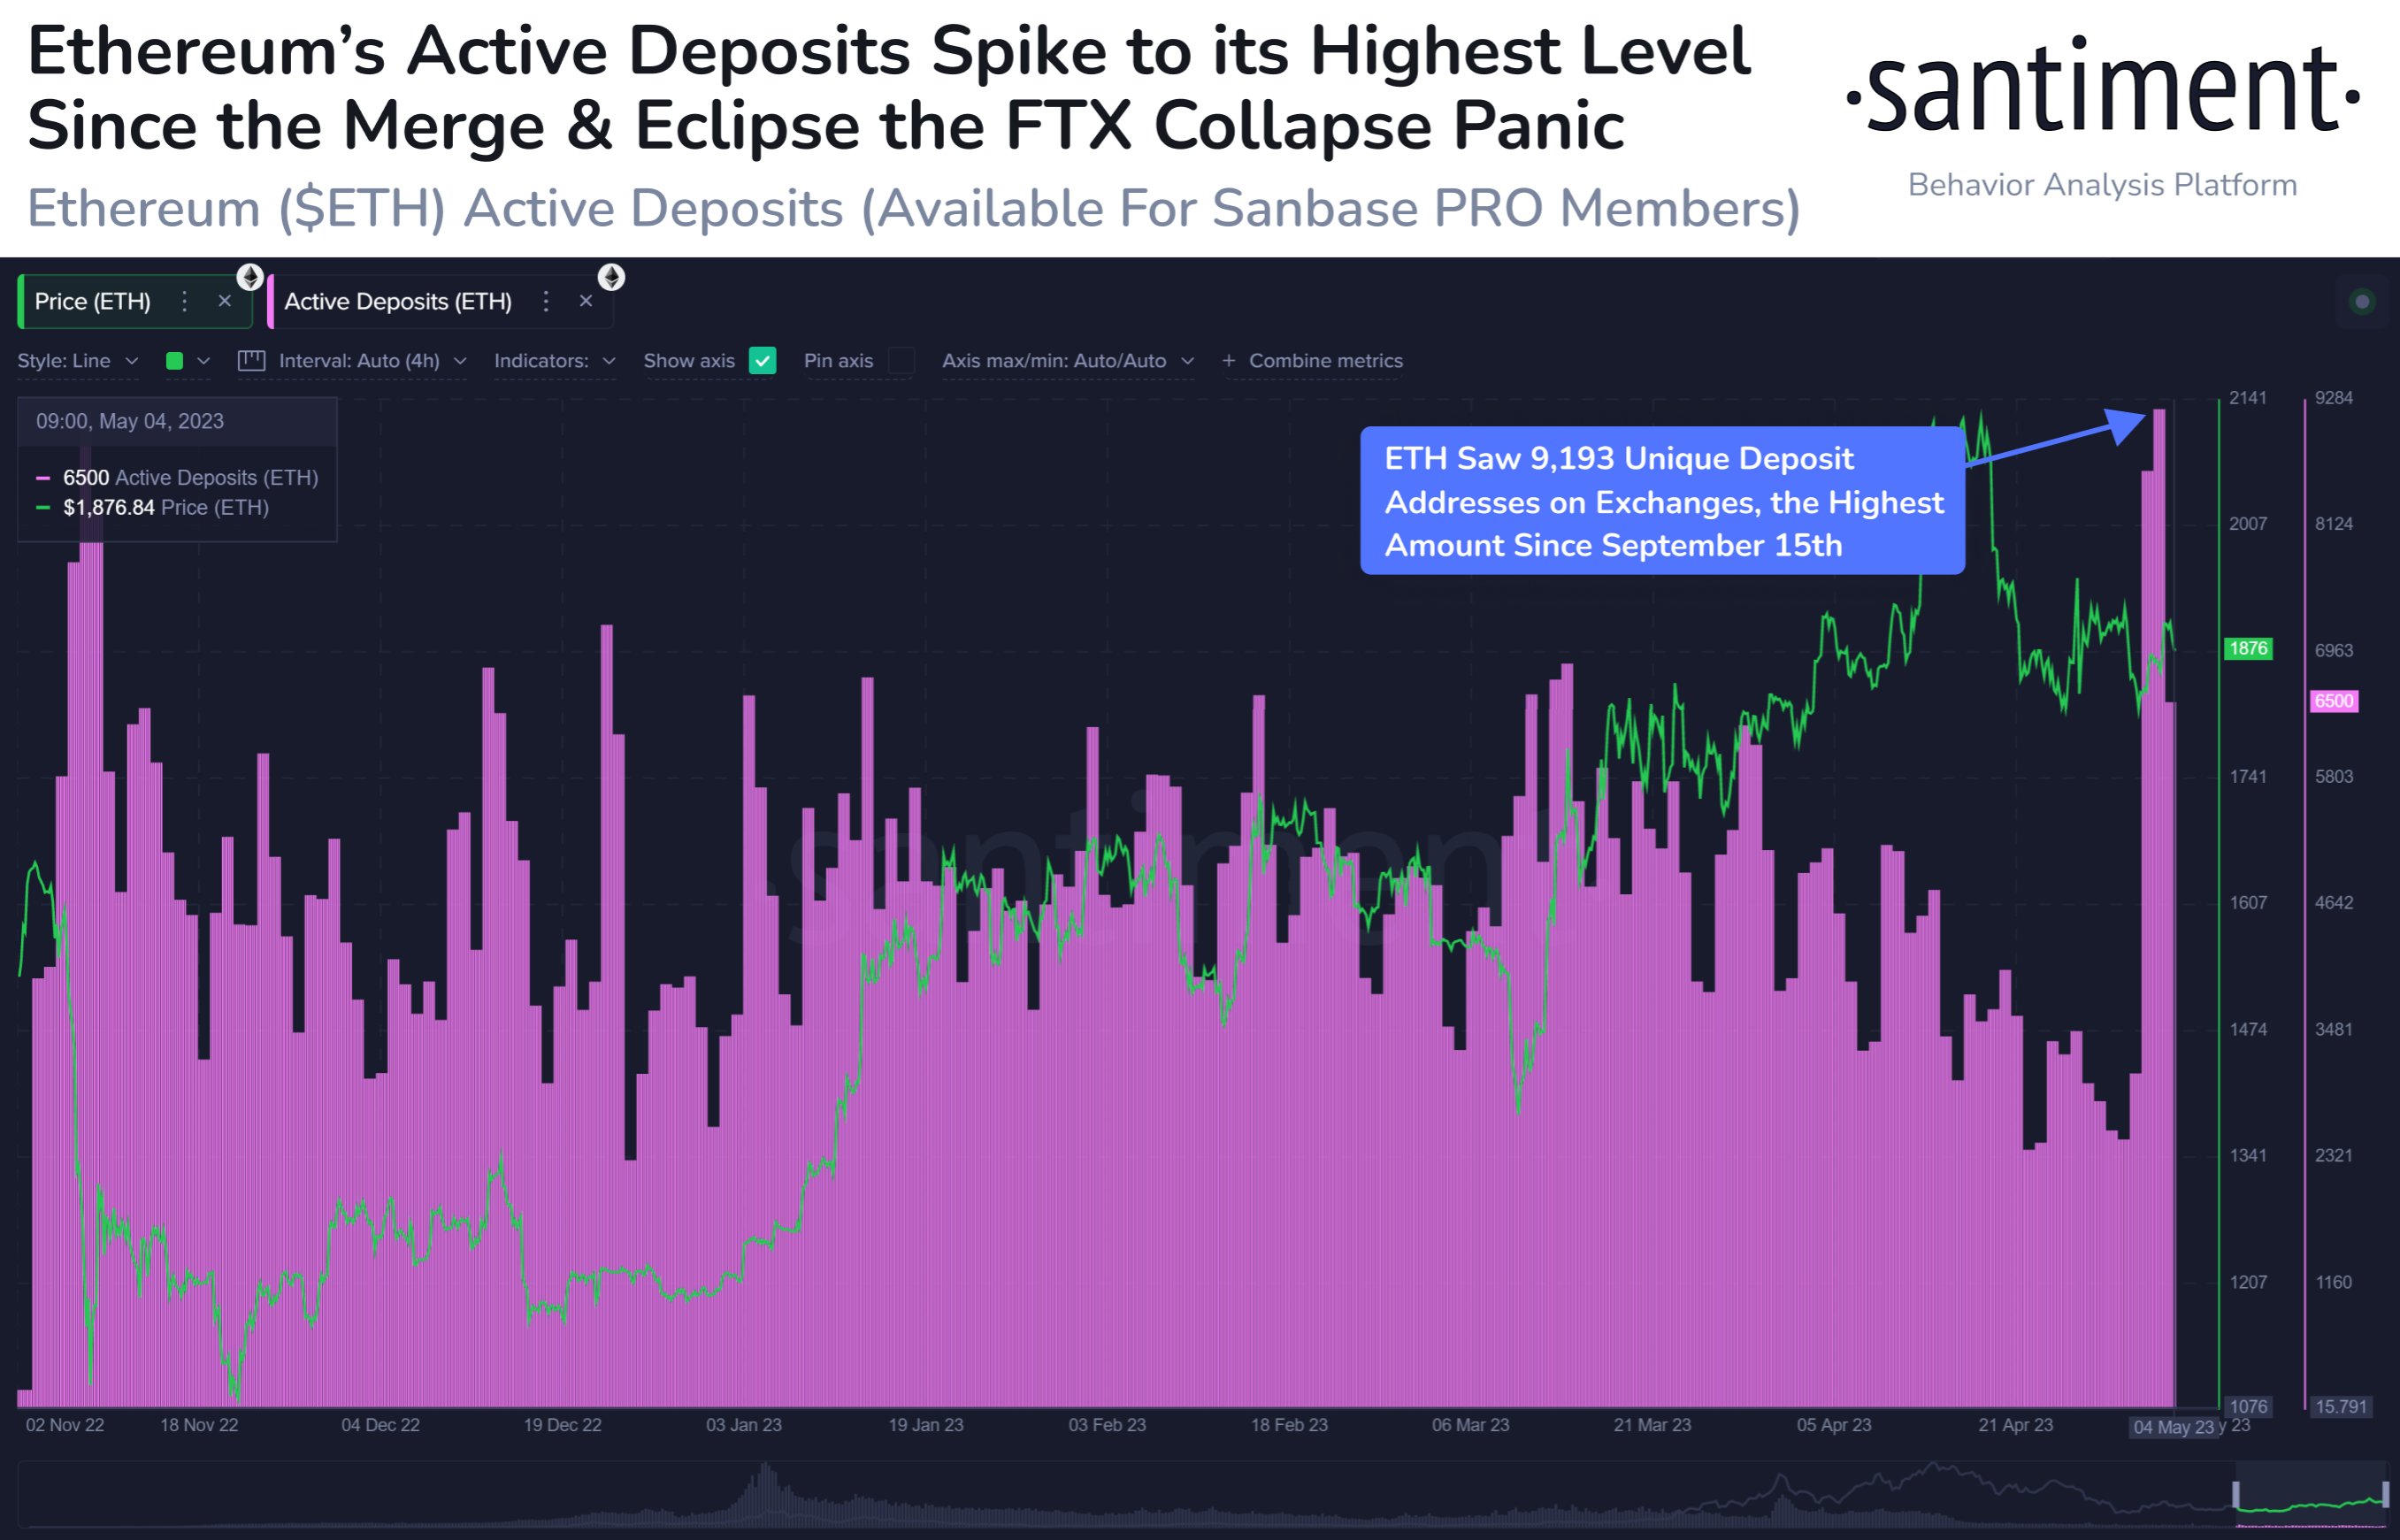
- Ethereum network’s active deposits to the Beacon Chain contract hit an eight month high, eclipsing the panic from the FTX exchange collapse.
- Experts believe the spike in Ethereum deposits could foreshadow any increase in volatility in ETH price over the next few weeks.
- Ethereum price continues its uptrend, sustains above the $1,800 level amidst rising macro uncertainty.

Ethereum network’s active deposits have exploded, hitting an eight-month high, the highest level since the blockchain’s transition from Proof-of-Work to Proof-of-Stake. ETH deposits climbed to the highest level since Merge and wiped out the decline from FTX exchange’s collapse.
Also read: These three catalysts are key to Bitcoin price rally to $35,000
Ethereum active deposits climb to an eight-month high
The volume of active deposits on the second-largest blockchain exploded, hitting an eight-month high. Deposits to ETH’s Beacon Chain contract hit an eight-month peak. Experts at crypto intelligence tracker Santiment are investigating the cause of the peak, and conclude that the spike in deposits could shadow the volatility in Ethereum price.
Ethereum active deposits
The spike in Ethereum deposits comes at a time when there is macroeconomic uncertainty and the US Fed raised interest rates by 25 basis points (bps). Typically, an increase in Ethereum deposits is indicative of a reduction in the circulating supply of Ether.
As the circulating supply of Ether reduces, there is a reduction in selling pressure on the asset, supporting a bullish thesis for ETH price.
Ethereum price sustains its upward trend
Ethereum price is currently in an ascending parallel channel. The altcoin is currently in an uptrend that started on November 22, 2022.
ETH price sustained above the midpoint of the channel, the altcoin is closer to the upper trendline of the parallel channel. ETH price broke above the parallel channel in mid-April 2023, before receding back inside the channel.
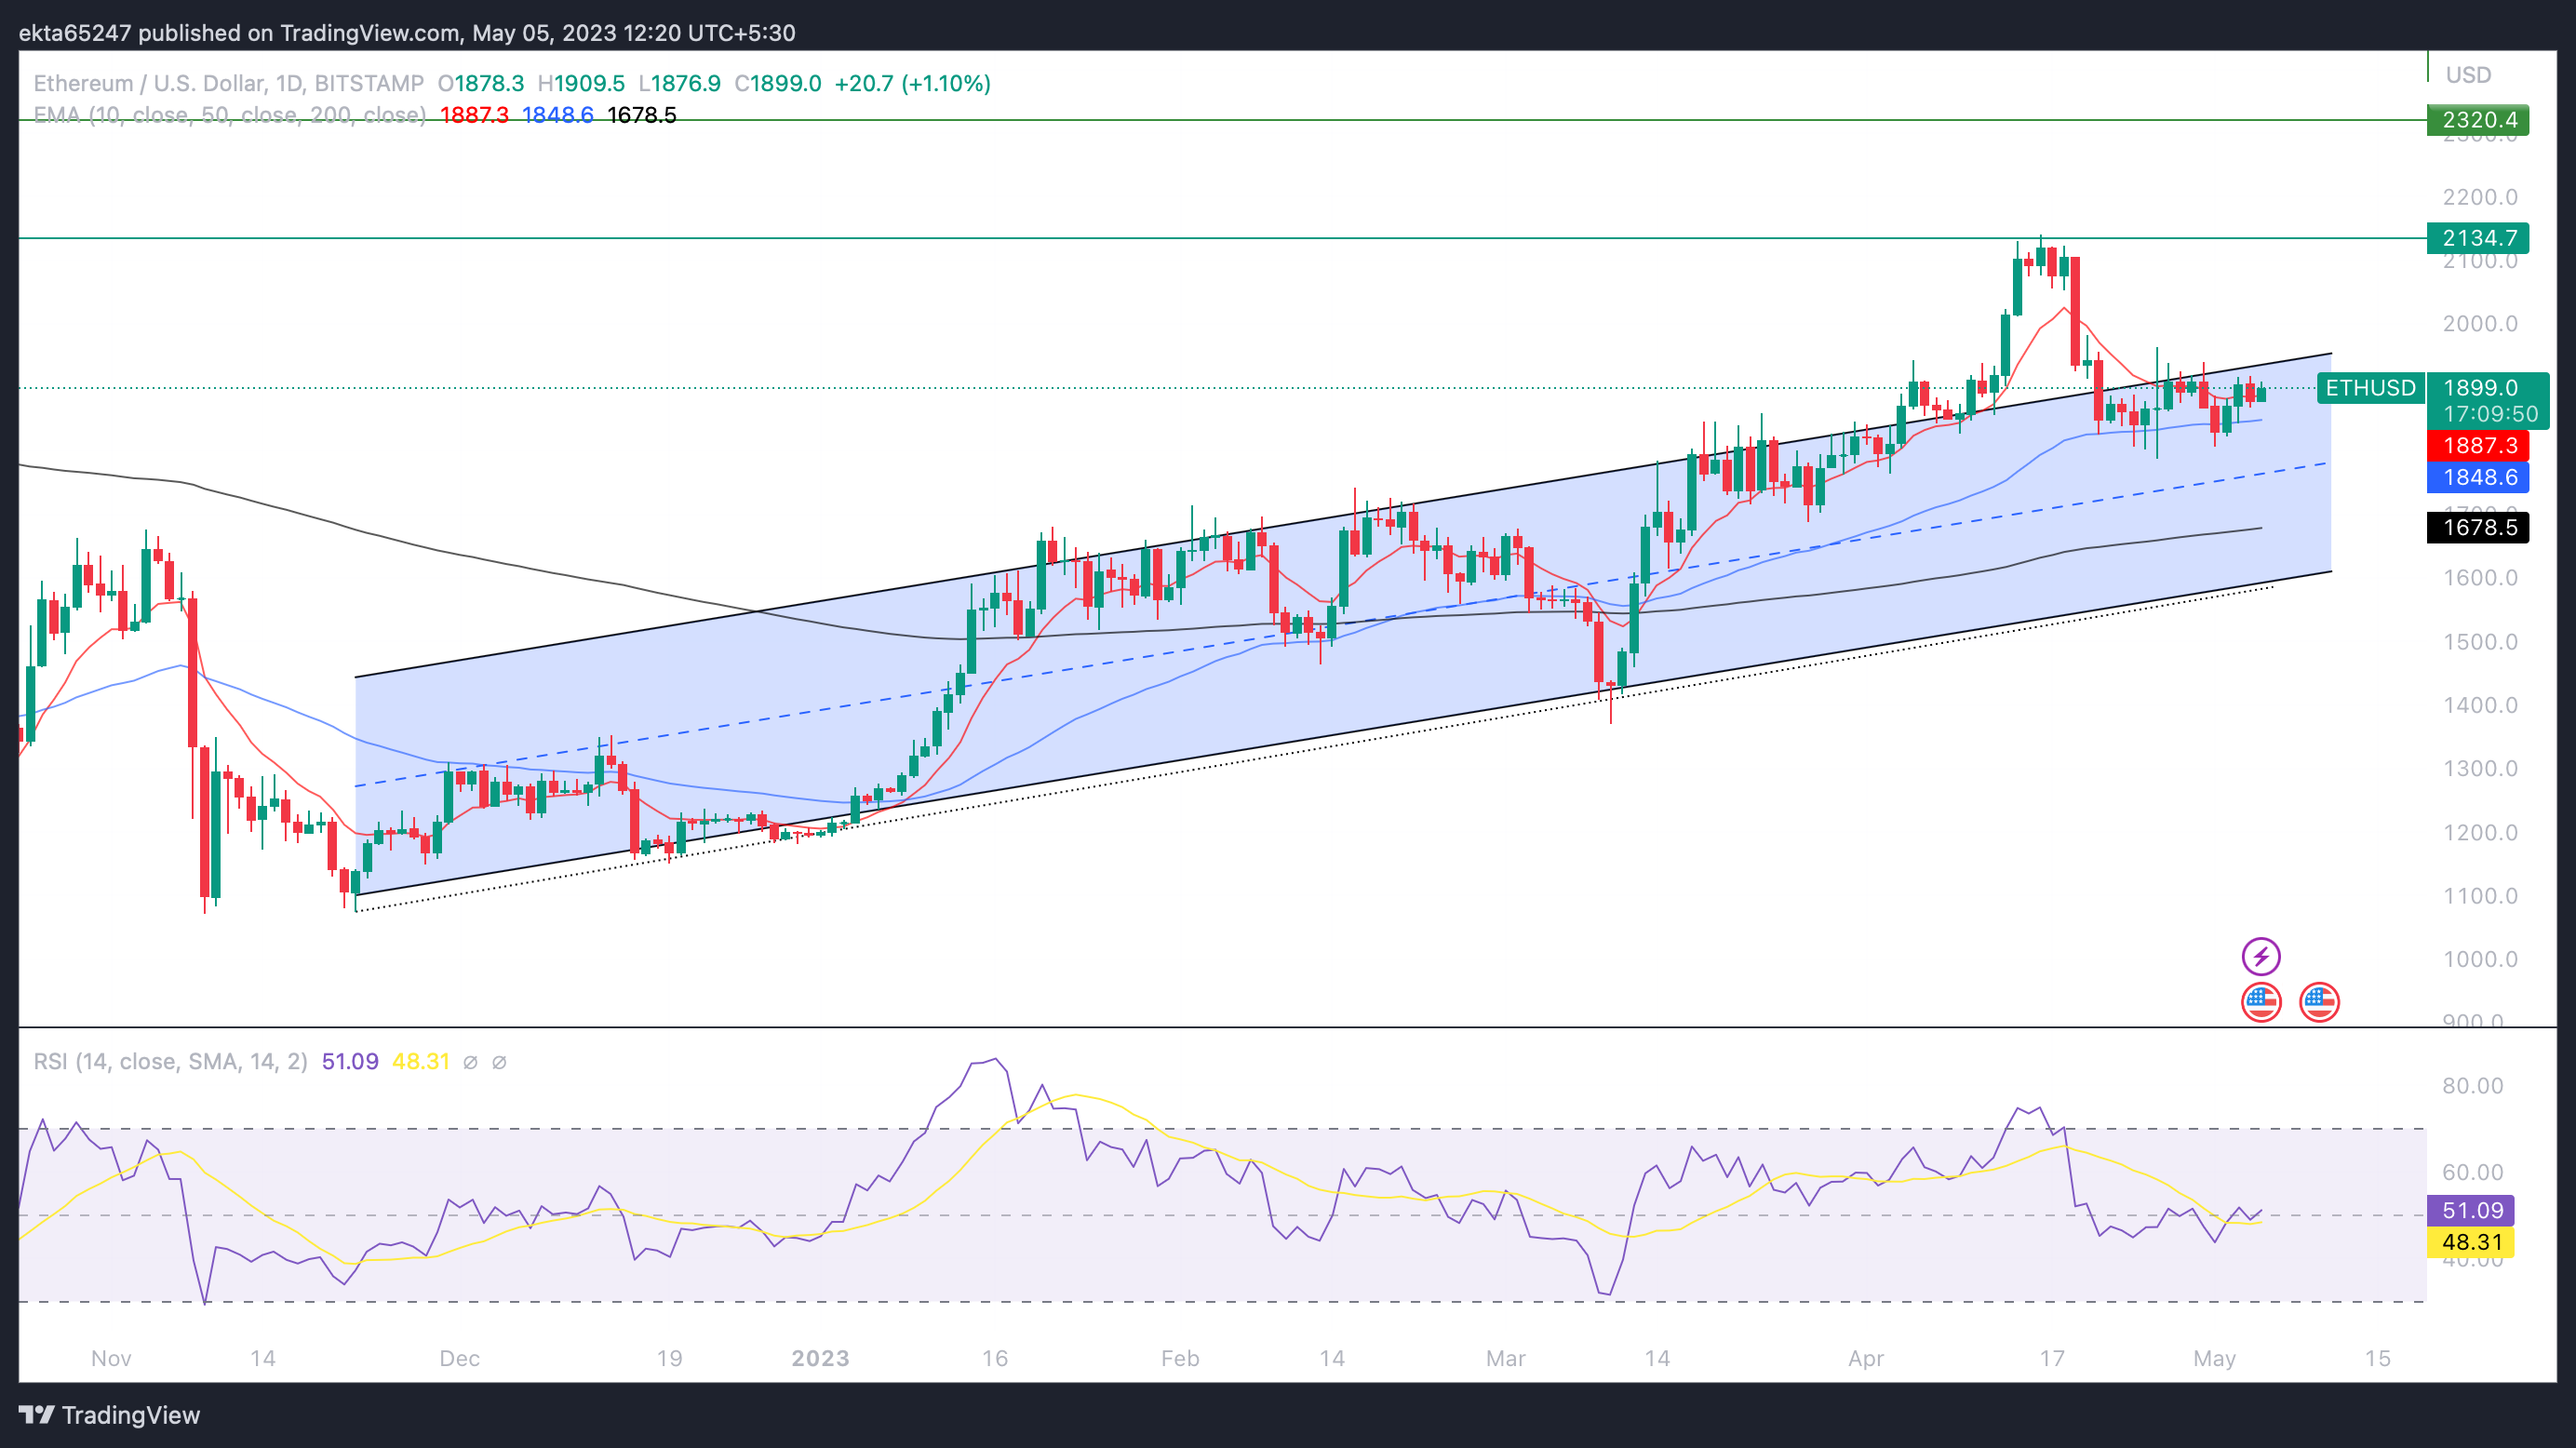
ETH/USD 1D price chart
The altcoin is on track to break out of the parallel channel on the upside. The immediate resistance is at $2,134. The bullish target for Ethereum is $2,320. A decline below the lower trendline at $1,678.5 could invalidate the bullish thesis for Ethereum.
Author

Ekta Mourya
FXStreet
Ekta Mourya has extensive experience in fundamental and on-chain analysis, particularly focused on impact of macroeconomics and central bank policies on cryptocurrencies.


