Ethereum Price Prediction: ETH/USD free-fall back to $380 beckons – Confluence Detector
- Ethereum is hanging at the edge of a cliff ($400) as losses eyeing $380 level call.
- ETH/USD bulls are struggling to build momentum above $400; more hurdles await at $407 and $411 respectively.

Ethereum has been nurturing a recovery momentum since the weekend dip to $380. The bulls’ efforts yielded on Monday with Ether reclaiming support at $400. However, the bullish price action was cut short before ETH/USD tested the resistance at $410. A reversal is underway at the time of writing but buyers are keen on keeping the price above $400.
ETH/USD is exchanging hands at $402 amid a gradually building bearish momentum. On the upside, price actions are limited by the 50 SMA in the 4-hour range. In addition, a descending trendline is also limiting movement. The trendline resistance has remained intact from the time Ether traded a new yearly high around $447.
According to other technical levels highlighted by indicators such as the RSI, Ethereum is likely to extend the bearish leg under $400. The RSI is pointing sharply downwards and a slide below the average and towards the oversold is expected in the short term.
On the bright side, the MACD has recovered to touch the midline from lower levels at -6.96. The presence of a bullish divergence from the indicator suggest that buying pressure is also present. However, Ethereum is not attracting enough volume to pull the price above $400 and towards $420.
If push comes to shove and Ethereum slides under $400, a free-fall could refresh the support at $380. The support range between $360 and $380 is expected to continue holding Ethereum from the frequent dips under $400. The 200-day SMA at $375.29 is also inline to prevent declines from wiping off the progress that has been made in the past couple of months.
ETH/USD 4-hour chart
 (88)-637339248877060217.png)
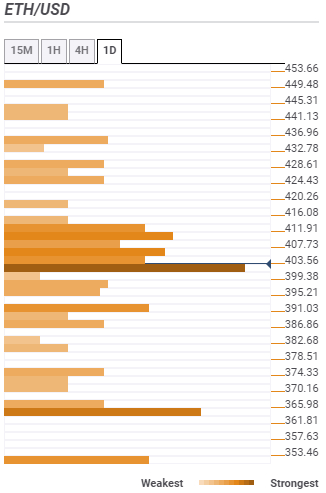
Ethereum Confluence Detector
Resistance one: $403.07 – Highlighted by the previous low 4-hour, the Fibonacci 38.2% one-day, the SMA five 15-minutes and the SMA 100 15-minutes.
Resistance two $407 – Home to the Bollinger Band one-day middle curve, the previous high 1-hour and the SMA 100 4-hour.
Resistance three: $411.41 – Highlighted by the Bollinger band 4-hour upper curve, the SMA 200 1-hour, the Fibo 38.2% one-week and the Bollinger band 1-hour upper curve.
Support one: $398 – As shown by the SMA 100 1-hour, the Bollinger Band 4-hour middle curve, the SMA 200 15-minutes and the Fibo 61.8% one-day.
Support two: $390 – Host the pivot point one-month resistance one.
Support three: $365 – A significant buyer congestion zone and home to the previous year high.
Author

John Isige
FXStreet
John Isige is a seasoned cryptocurrency journalist and markets analyst committed to delivering high-quality, actionable insights tailored to traders, investors, and crypto enthusiasts. He enjoys deep dives into emerging Web3 tren


