Ethereum Price Forecast: ETH crash to $1,000 can be prevented on the reclaim of a key resistance level
- Ethereum price created a multi-month ascending triangle pattern that breached the downside.
- ETH is currently retesting the $1,639 resistance level that has been pivotal for the past year.
- The theoretical forecasting method hints at a 45% crash for ETH after the bearish breakout.

Ethereum (ETH) price breached its multi-month consolidation, favoring the bears. This breakout has caused panic among investors, and if the outlook does not improve for ETH, more downside is likely. While the weekend price action has given bulls some hope, ETH needs to overcome two key resistance levels before investors can breath a sigh of relief.
Read more: Ether crosses $1.6K, Bitcoin SV leads Altcoin gains with 30% bump
Ethereum price at crossroads
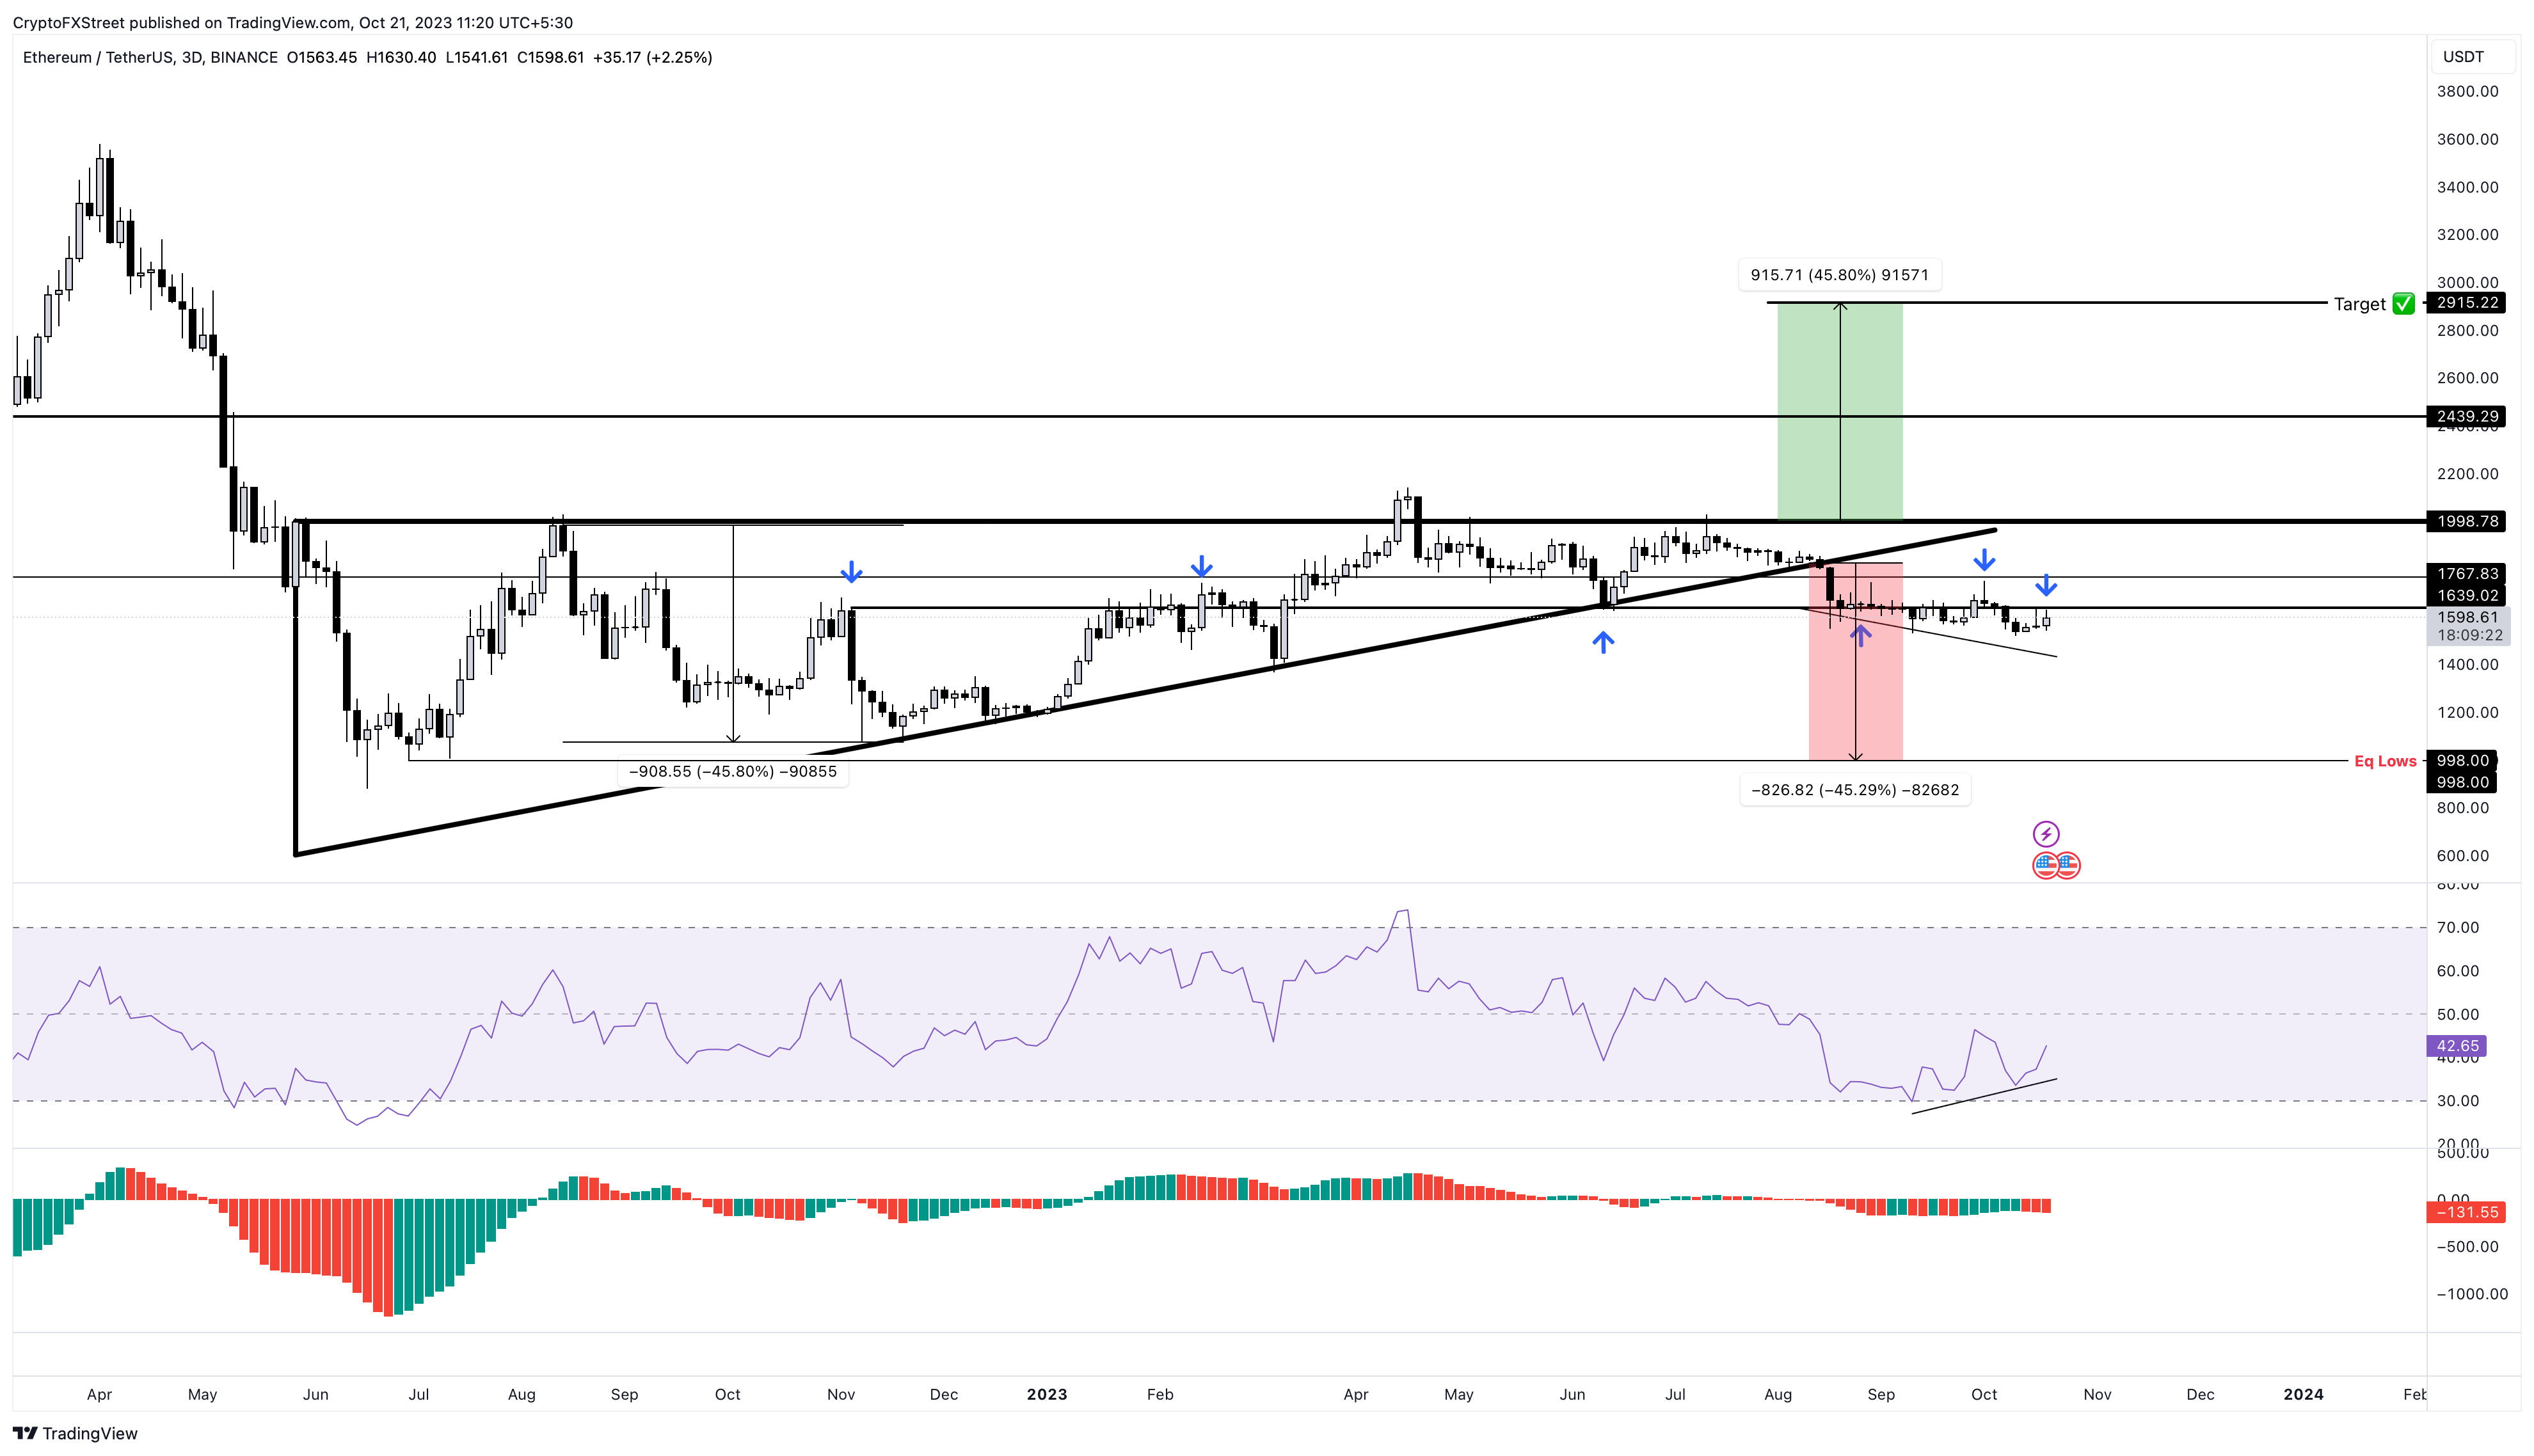
Ethereum (ETH) price set up four higher lows and three equal highs since May 2022. Connecting key swing points using trend lines reveals an ascending triangle pattern. This technical formation is bullish, and a decisive breakout forecasts an uptrend equal to the distance between the first swing high and swing low.
But for Ethereum price, the breakout was bearish, which forecasts a 45% crash to $998. This target is obtained by adding the distance between the first swing high and swing low to the breakout point at $1,825.
In its descent, Ethereum price has already breached the $1,639 support level, which has been key for the past year. If buyers fail to overcome this hurdle, it is likely ETH will continue its southbound move and eventually tag the $1,000 psychological level. From the current position of $1,598, this descent would constitute a 38% crash.
Also read: Solana vs. Ethereum: Renewed debate erupts over efficiency, development and scalability
ETH/USDT 4-hour chart
On the other hand, Ethereum price has produced three distinctive higher lows over the past month, which are not confirmed by the Relative Strength Index (RSI). This non-conformity is termed as bullish divergence and often leads to a small rally to the upside.
Due to the aforementioned bullish signal, if Ethereum price manages to flip the $1,639 hurdle into a support floor on the daily or three-day time frame, it could provide bulls a respite. This move could likely attract more sidelined buyers and potentially trigger a minor rally to retest the next key resistance levels at $1,767 and $2,000.
Author

Akash Girimath
FXStreet
Akash Girimath is a Mechanical Engineer interested in the chaos of the financial markets. Trying to make sense of this convoluted yet fascinating space, he switched his engineering job to become a crypto reporter and analyst.


