Ethereum Price Forecast: Indication of a 45% crash of bear trap?
- Ethereum price shows a breakdown from an ascending triangle formation, hinting at a potential correction.
- While the theoretical forecasts hint at a 45% crash, the recent breakdown suggests bears are in control.
- Ether’s open interest has surged by nearly 500 million in the last three days, suggesting a renewed interest.

Ethereum price action is at an interesting point, which could trigger a steep move in either direction. With Bitcoin’s boring consolidation, crypto traders have been waiting for a volatile move to emerge. The lack of volatility could be ending soon, especially for Ether, as the open interest rose by nearly 500 million in the last three days from $6.09 billion to $6.58 billion. When the breakout does occur, one cap is likely to get caught in the wrong direction, causing liquidations in the millions.
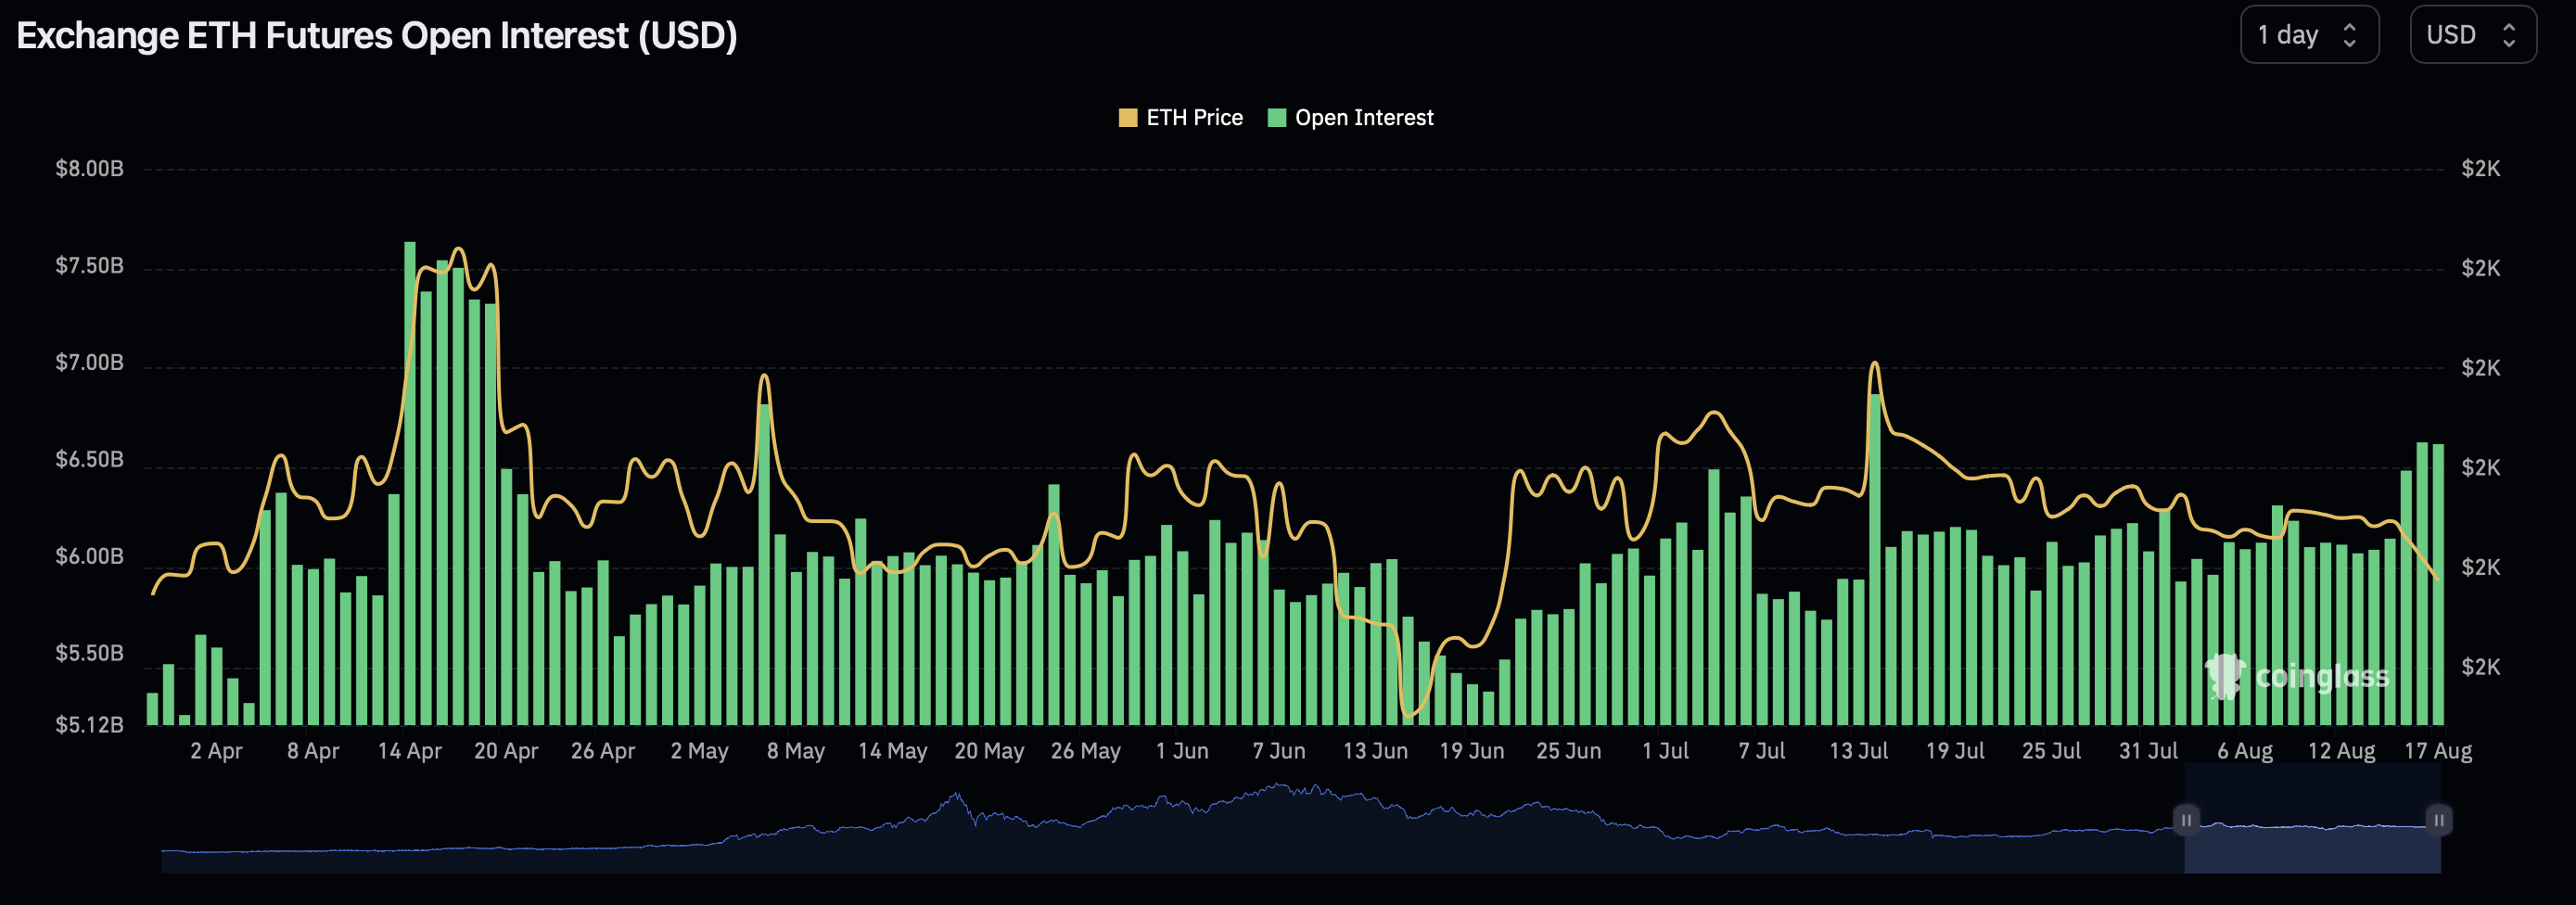
ETH open interest
Also read: Fundstrat's Tom Lee's Bitcoin target is $180,000 if SEC approves first spot BTC ETF in the US
Ethereum price action hints at a massive move soon
Ethereum price set up an ascending triangle formation between May 28, 2022, and August 14, 2023. This setup contains three higher lows and nearly three equal highs, which are connected using trend lines.
This technical formation is a bullish one and the confirmation of a breakout would occur if Ethereum price flipped the $1,998 or $2,000 psychological level into a support floor. The ascending triangle pattern forecasts a 45% upswing to $2,915, which is obtained by adding the distance between the first swing high and swing low to the breakout point.
On the contrary, Ethereum price breached the setup to the downside on August 13 and is on its way to confirming the breakdown by producing a three-day candlestick close below it. If this outlook does play out, instead of the 45% rally, ETH could crash by 45% and revisit the next key level at $998. But in some cases, ETH could stop around or above the $1,000 psychological level, which is not too far away from the theoretical target.
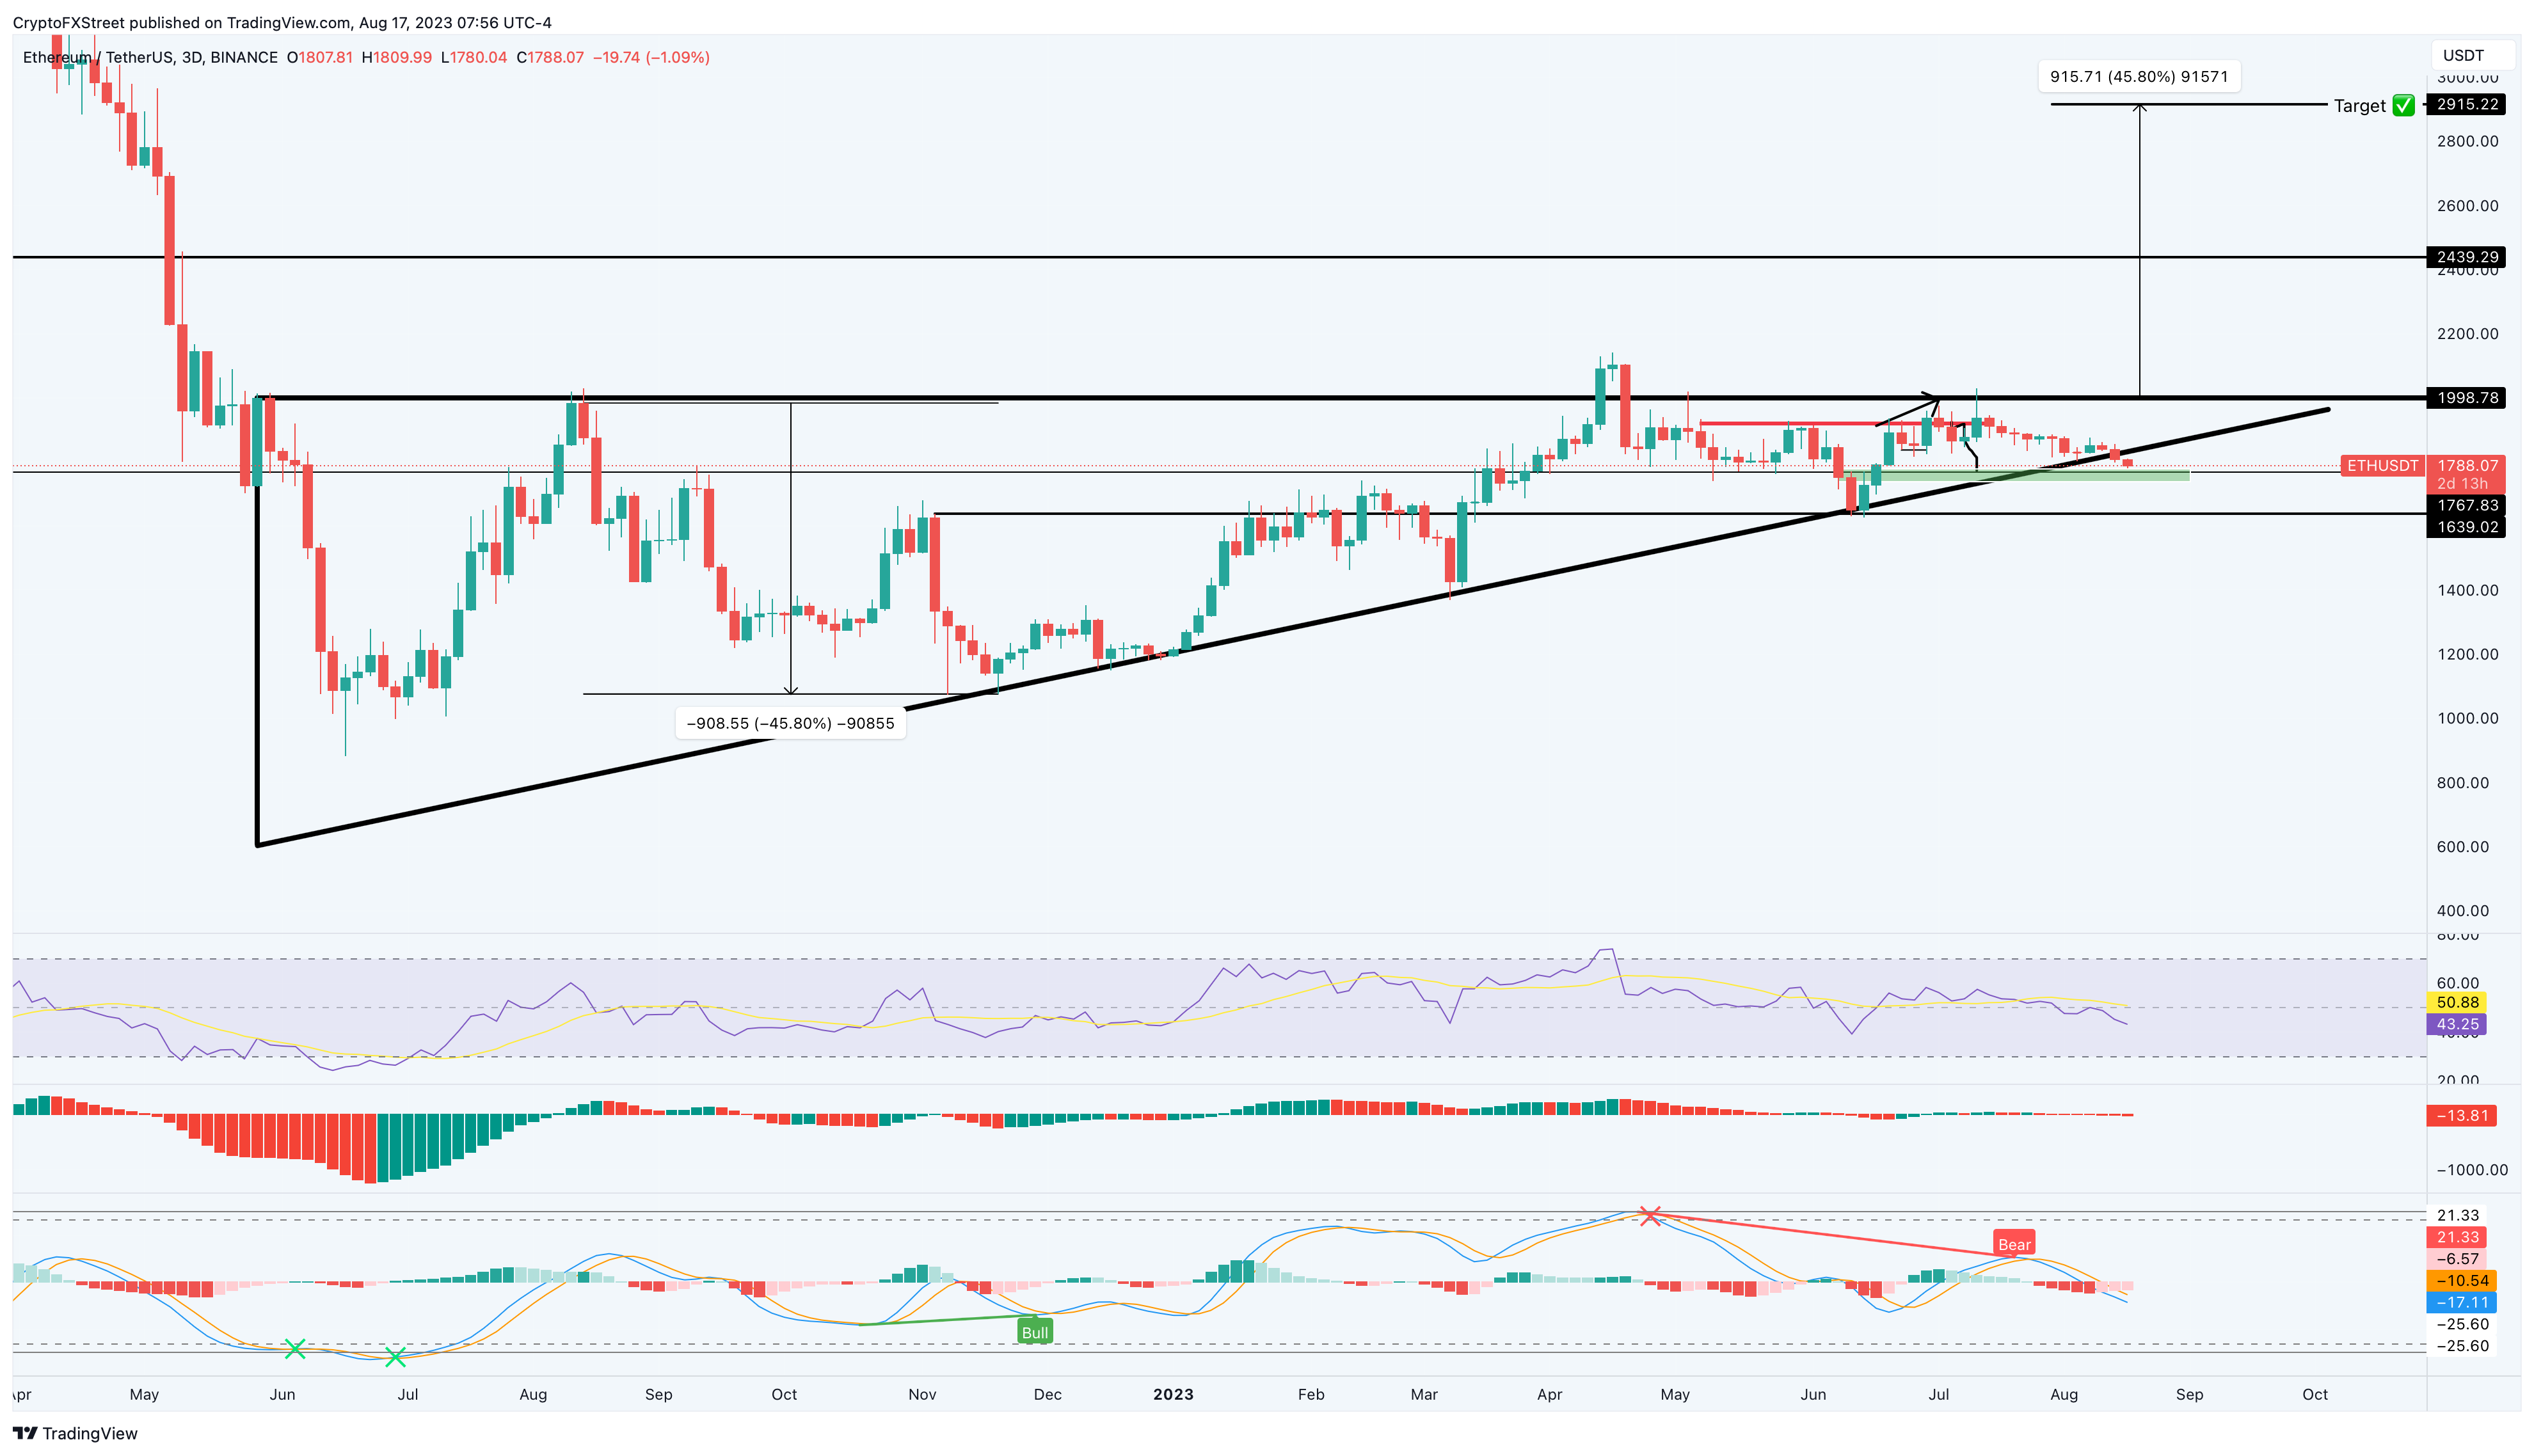
ETH/USDT 3-day chart
However, if Bitcoin’s consolidation breaches to the upside, bears that shorted ETH thinking a bearish breakdown has occurred would be trapped. In such a case, Ethereum price could quickly climb higher and flip the $2,000 psychological level. This development could confirm a bullish breakout, forecasting a 45% move to $2,915.
In bullish cases, Ethereum price could revisit the $3,000 level that has not been tagged since April 20222.
Author

Akash Girimath
FXStreet
Akash Girimath is a Mechanical Engineer interested in the chaos of the financial markets. Trying to make sense of this convoluted yet fascinating space, he switched his engineering job to become a crypto reporter and analyst.


