Ethereum Price Prediction: ETH begins its recovery after disastrous flash crash
- Ethereum price has produced a bullish daily close above a crucial support level despite Wednesday’s crash.
- A decisive close above 50-day SMA at $2,769 will confirm the start of a new uptrend to $3,430.
- If ETH breaks down $2,106 in a convincing fashion, a bearish scenario might come into play.

Ethereum price seems to be making a comeback after dipping deep into levels last seen in late March. Despite the bearish sell-off, ETH is rising quickly and is approaching a critical resistance level, crossing it will confirm the start of an uptrend.
Ethereum price appreciates as bulls take control
Ethereum price crashed 46% on May 19 as it dipped from $3,441 to $1,850. Although the bears ran rampant, the bulls managed to push ETH from $1,850 to $2,446, pushing it above a key demand zone that ranges from $2,106 to $2,397.
Such a daily candlestick close indicates that the buyers were busy scooping up the smart contract token for a discount. While this development is bullish, a close above the 50-day Simple Moving Average (SMA) at $2,769 will confirm the start of an uptrend.
If this were to happen, investors could expect the altcoin pioneer to rally 23% to tag the immediate resistance level at $3,430.
Following a breach of this level, $3,610 is a supply barrier that the buyers could target.
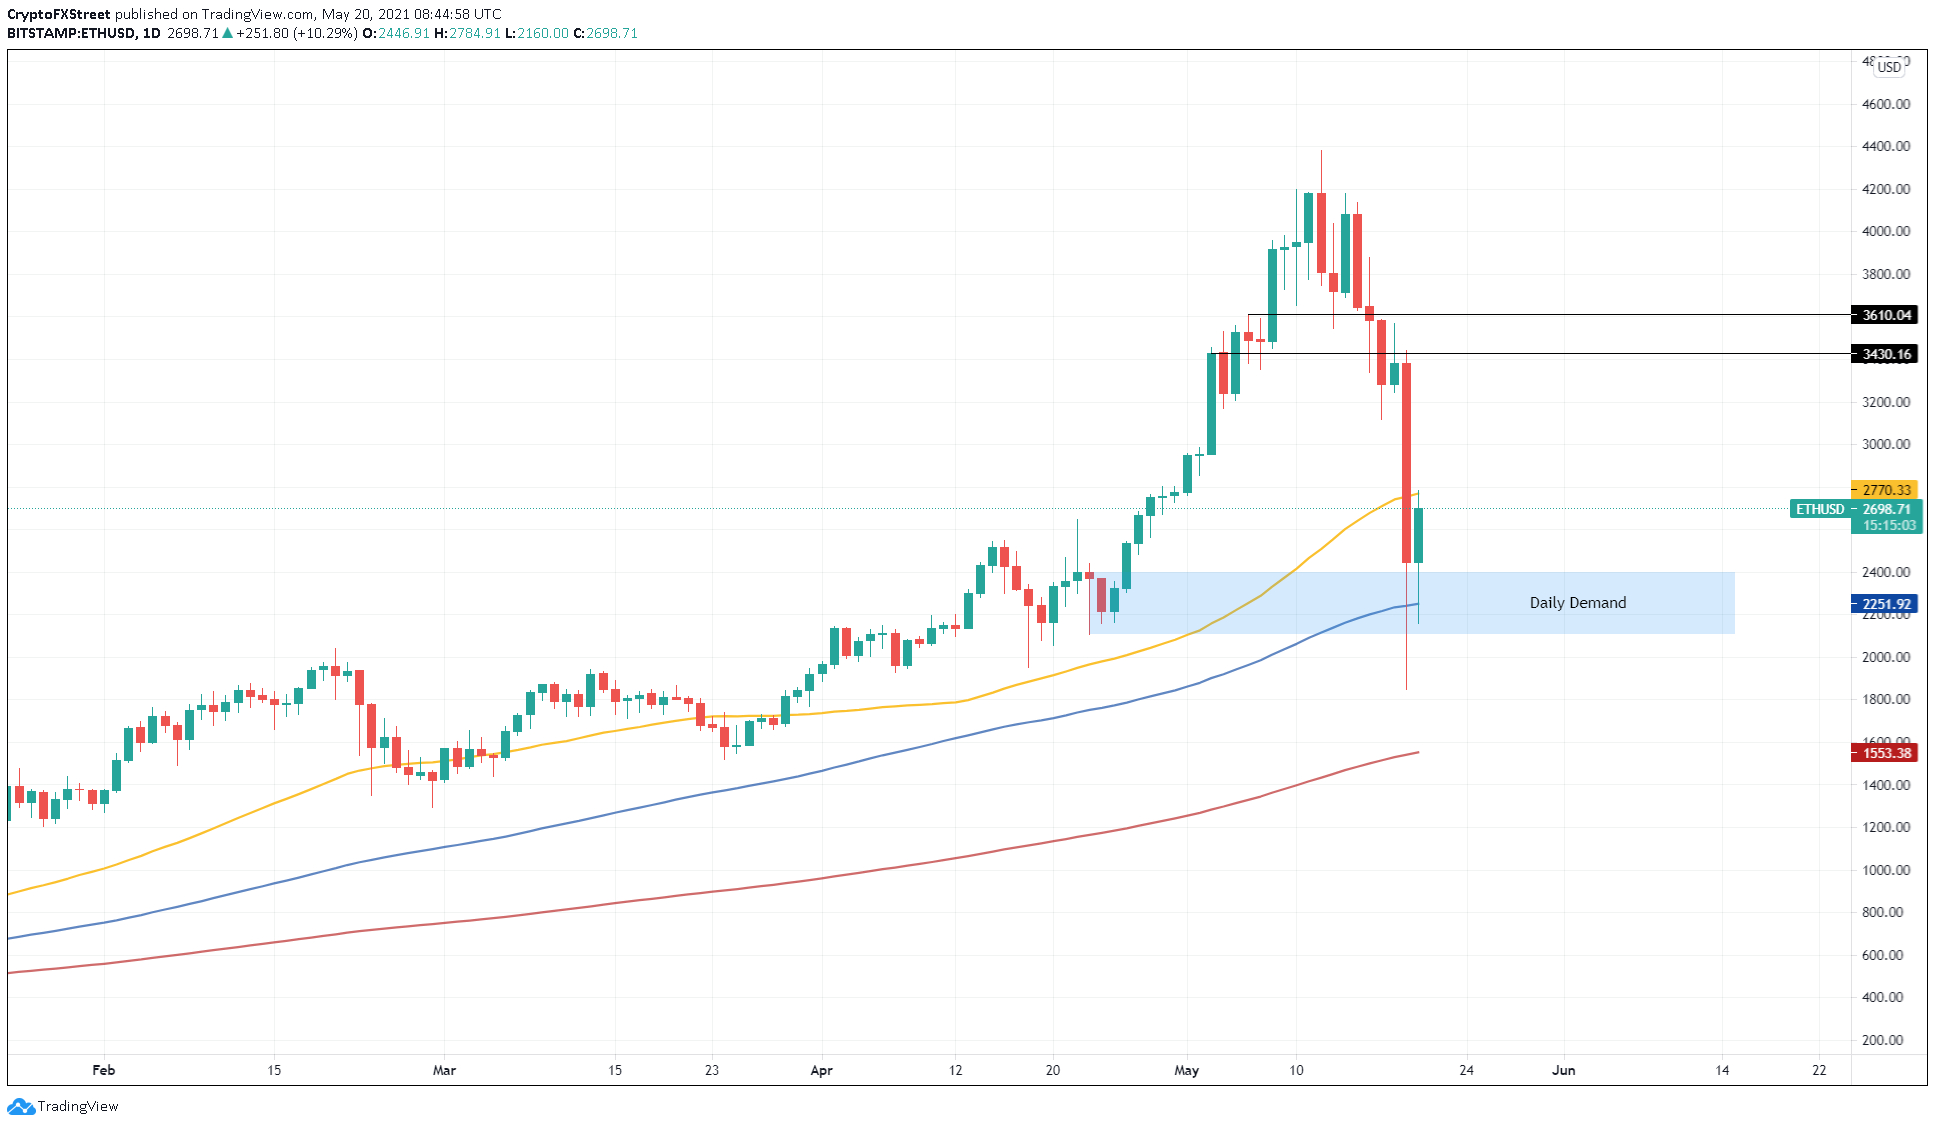
ETH/USD 1-day chart
Adding credence to this upswing scenario is the shortage of ETH available on the exchanges. The supply of Ethereum held on centralized entities dropped from 21.9 million to 20.81 million from its all-time high on May 12. This 5% decline suggests that investors are optimistic about ETH’s performance.
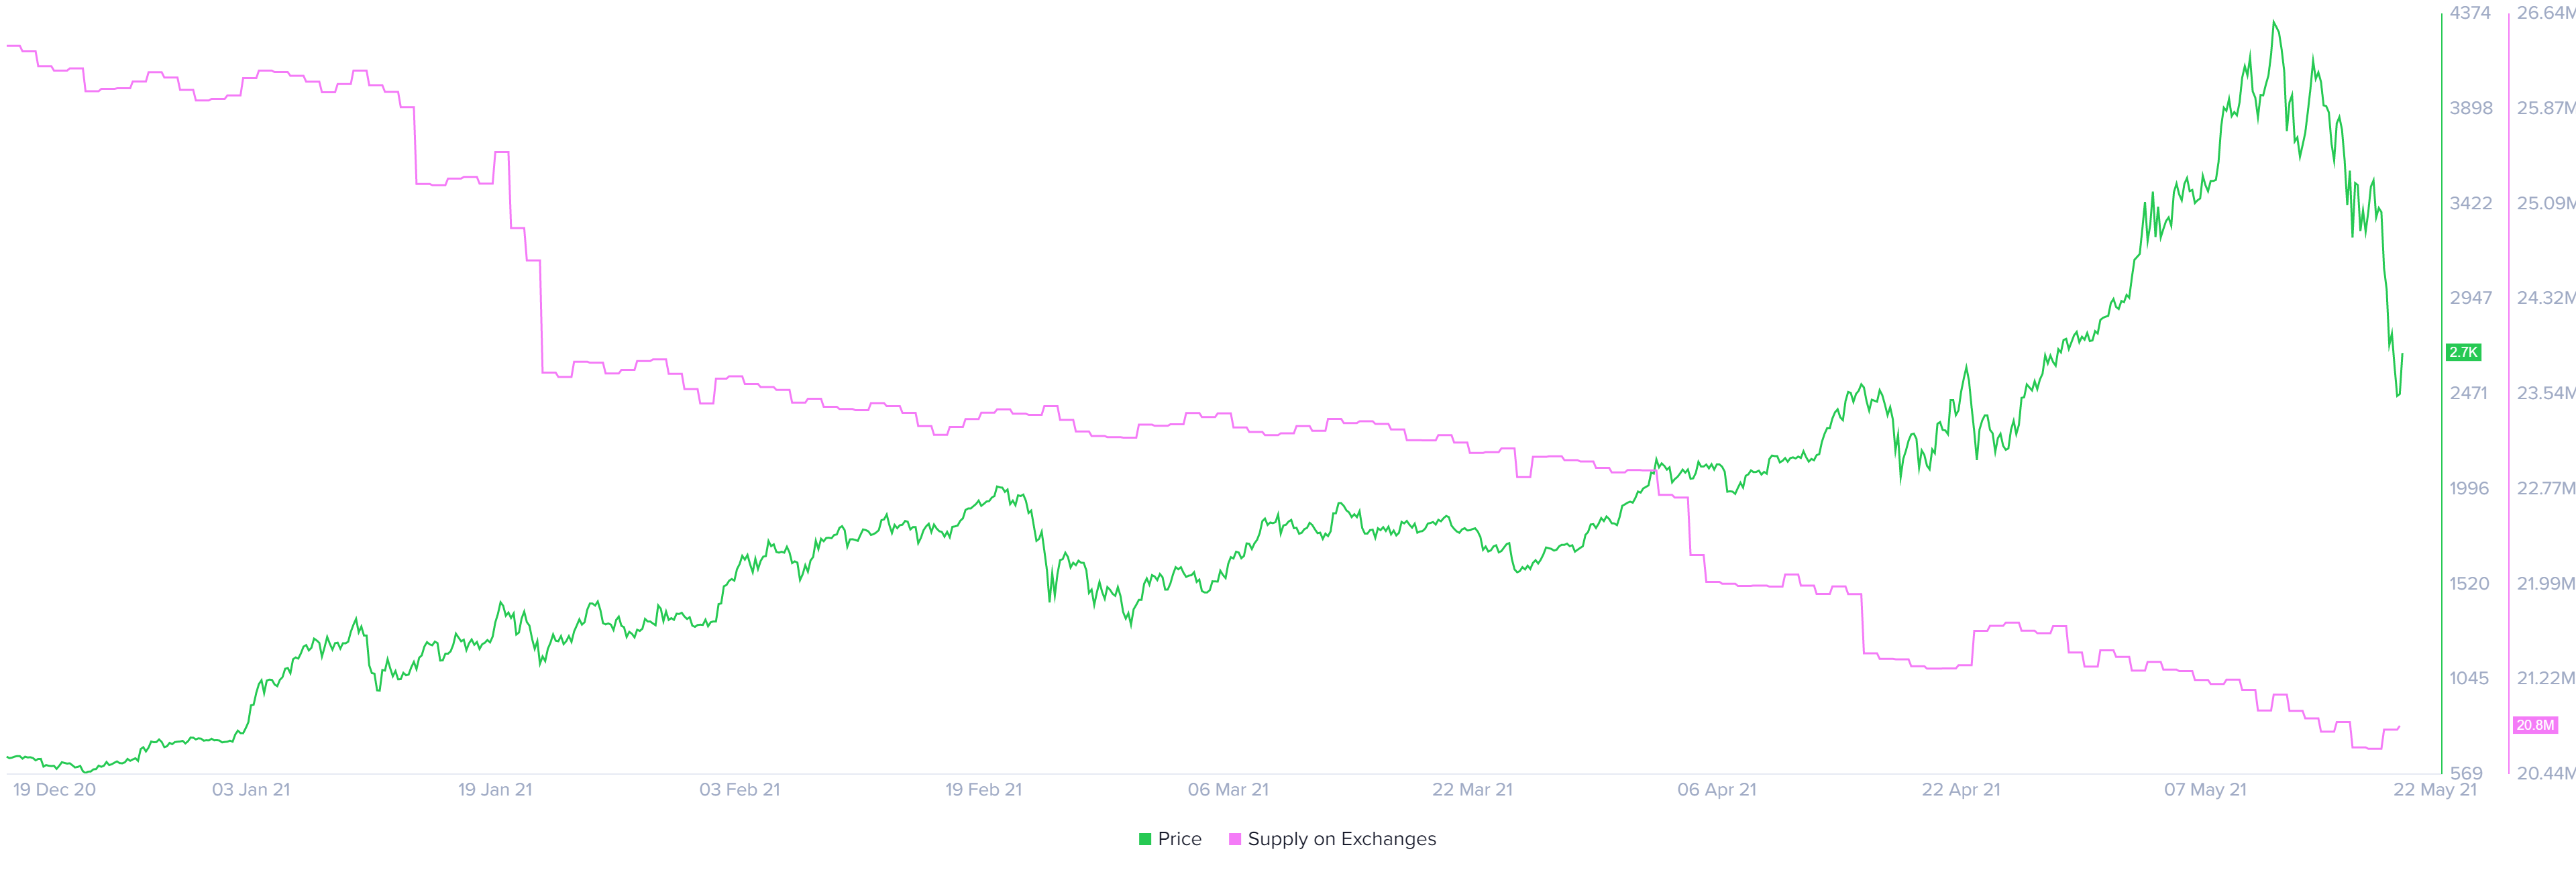
ETH balance on exchanges chart
During yesterday’s crash, the 30-day Market Value to Realized (MVRV) dropped to -24% in the opportunity zone, a level last seen during March 2020. This metric measures the profit/loss of investors who purchased ETH in the past month.
The dip into negative territory represents short-term sellers booking profits, allowing the long-term holders to accumulate more.
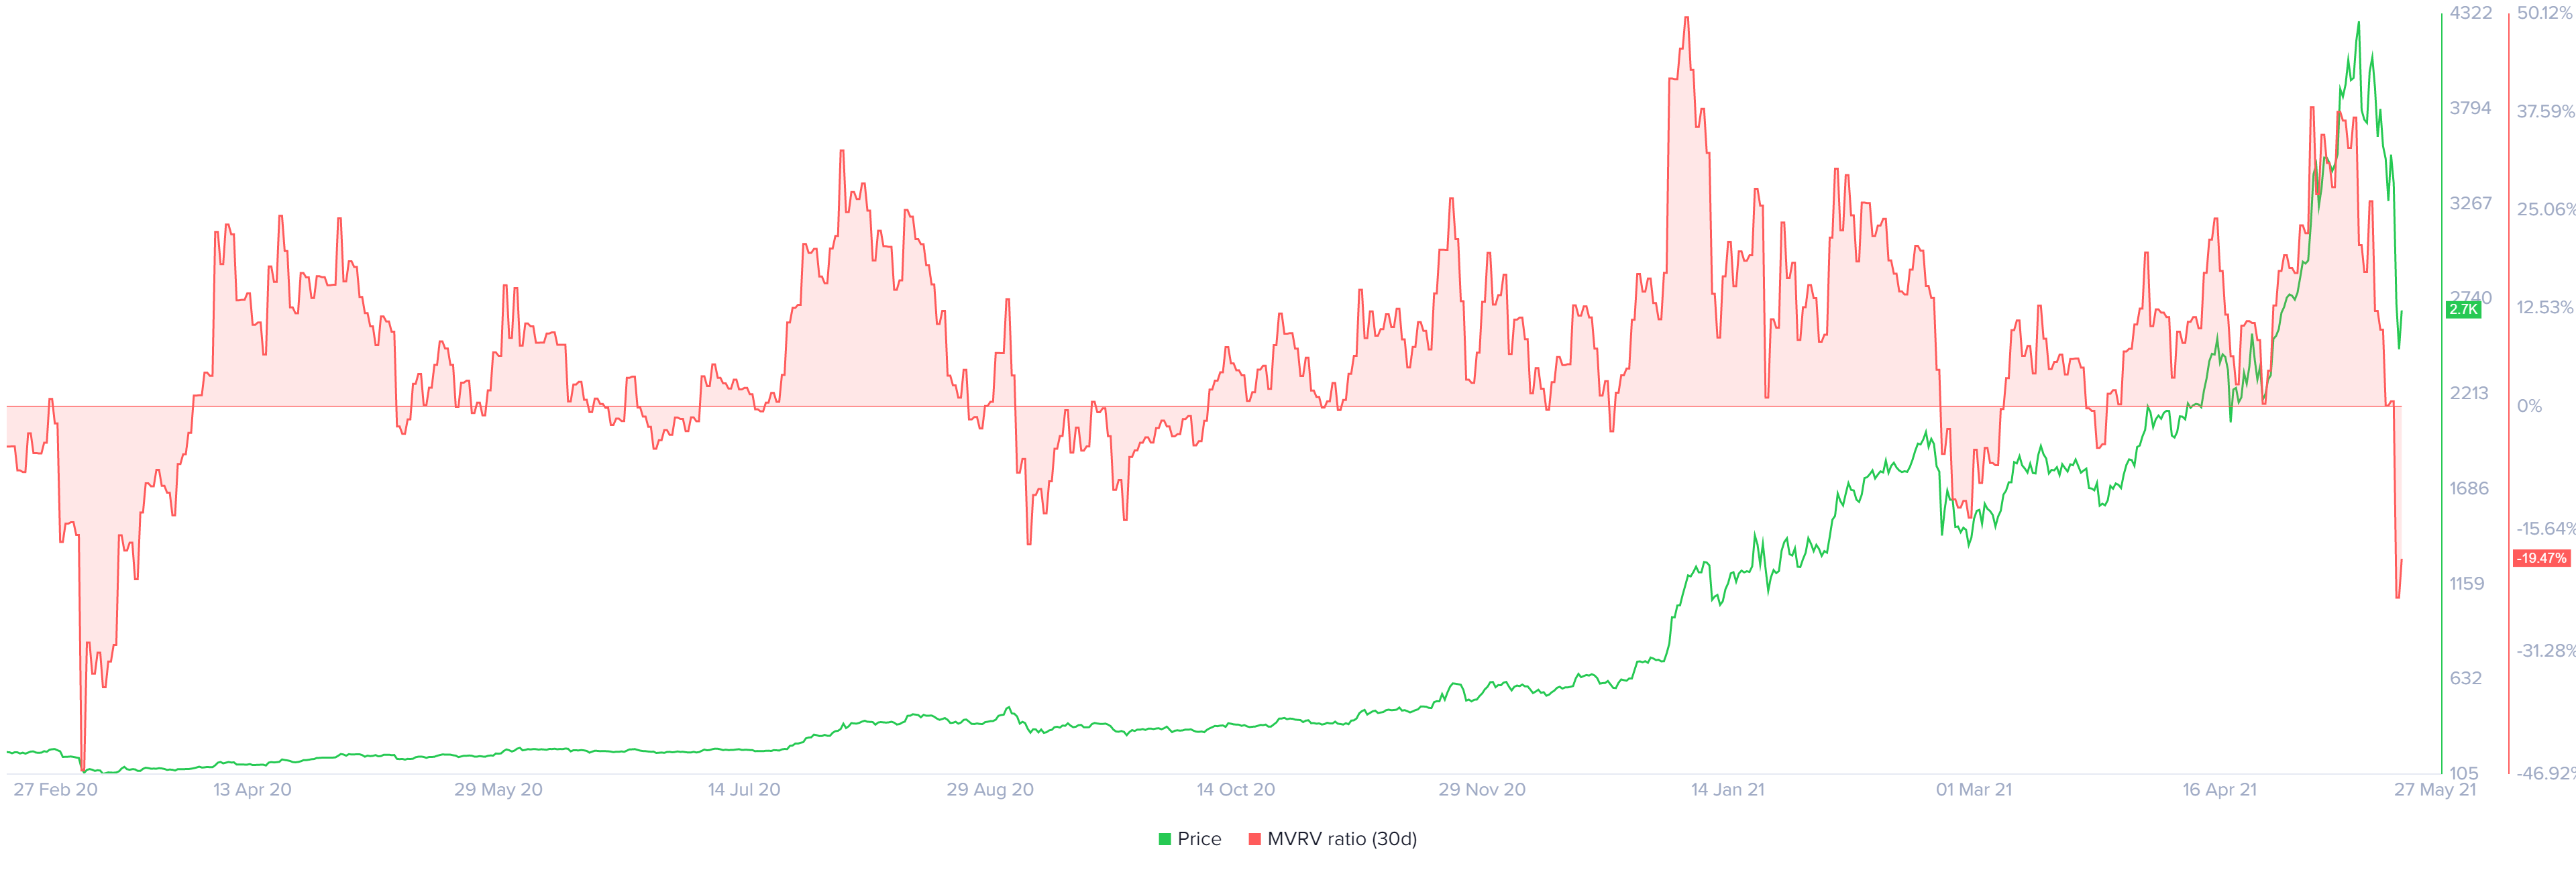
ETH 30-day MVRV chart
While the above on-chain metrics paint a bullish picture for Ethereum price, the supply distribution reveals a bearish outlook for ETH. Whales holding between 1,000,000 to 10,000,000 have declined by 33% since May 9.
Roughly six investors that fall into this category have sold their holdings or reallocated them, indicating fleeing capital and holders with a bearish outlook on ETH.
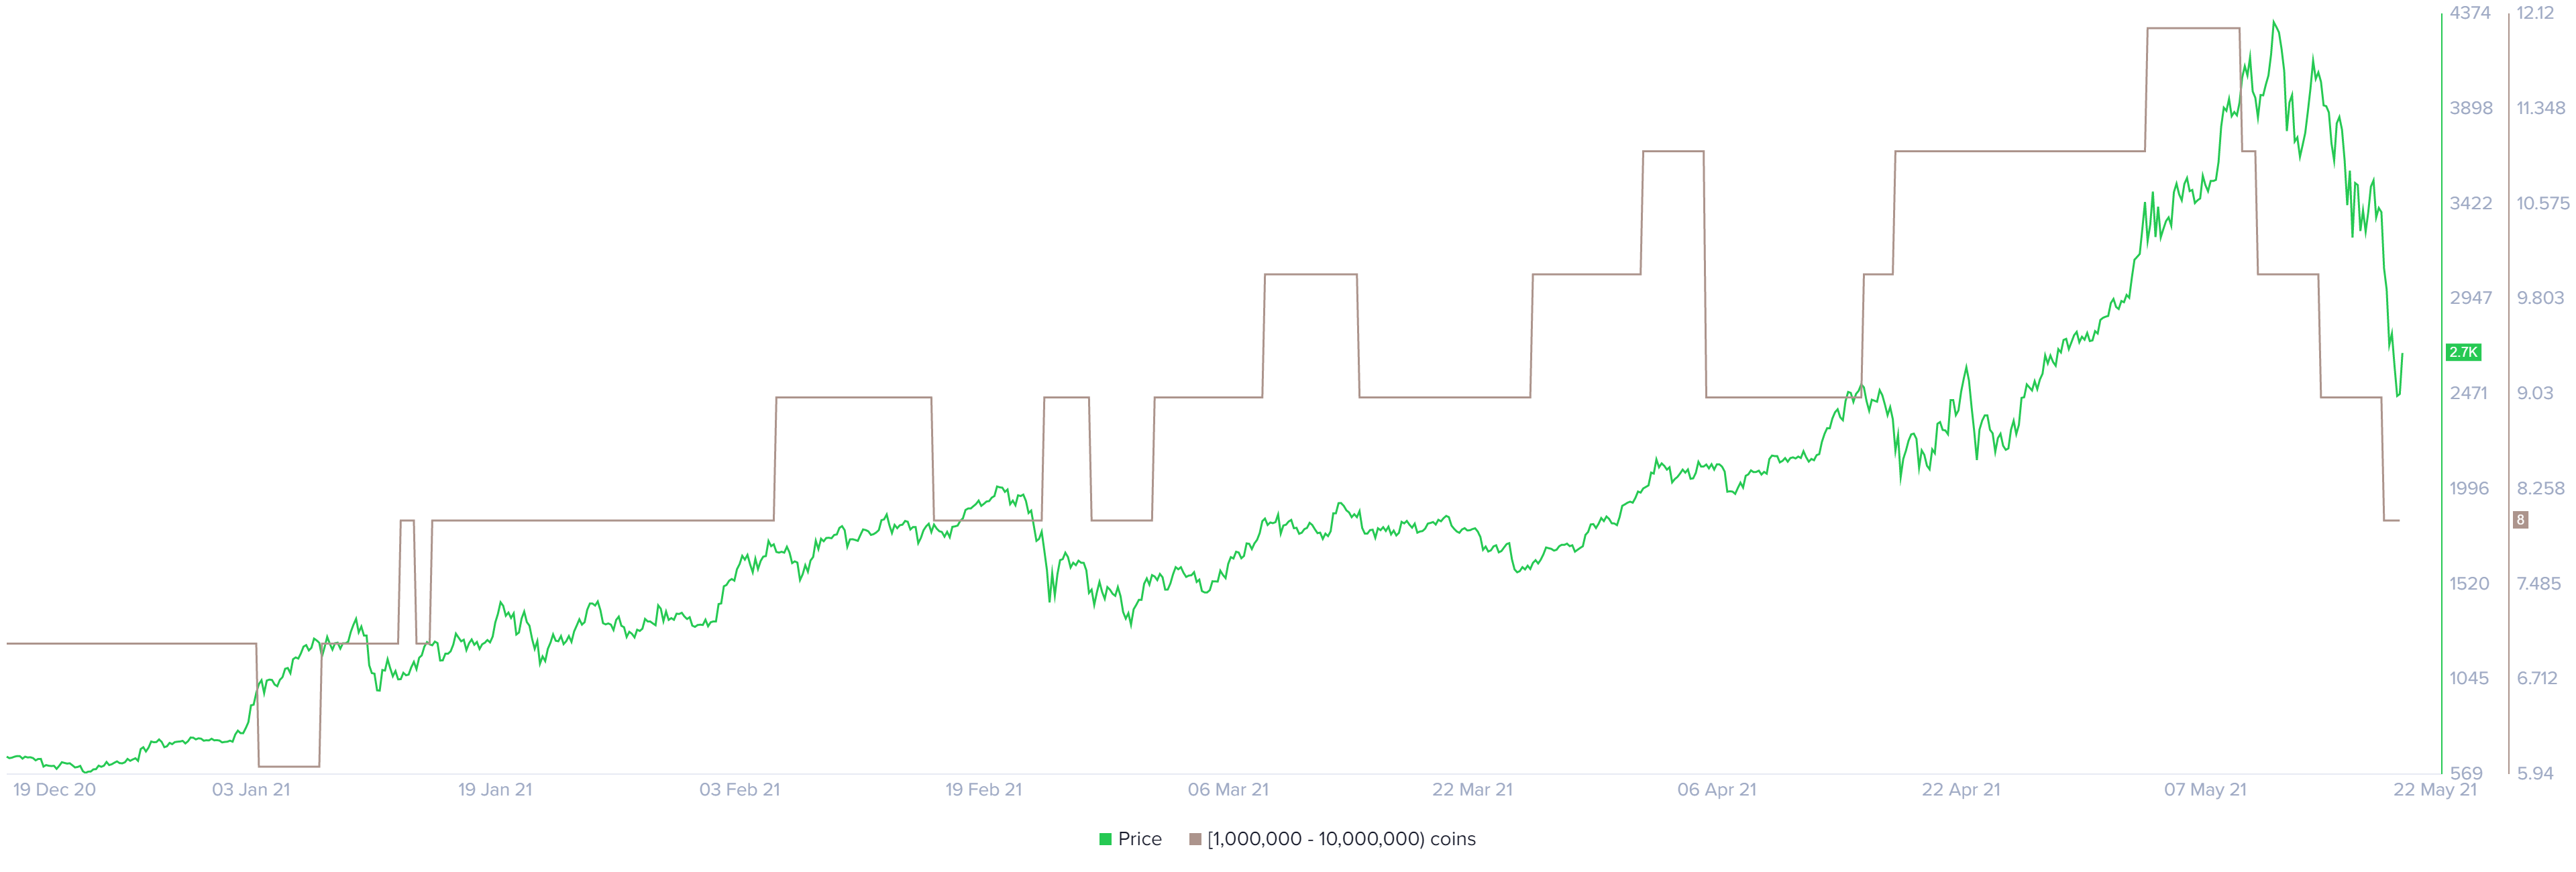
ETH supply distribution chart
Therefore, if more of these whales start to exit the Ethereum network, it is likely to push ETH price below $2,110. Such a move would invalidate the bullish thesis and kick-start a 12% downswing to $1,848.
If the momentum continues to build up, ETH price could slide toward the 200-day SMA at $1,553.
Author

Akash Girimath
FXStreet
Akash Girimath is a Mechanical Engineer interested in the chaos of the financial markets. Trying to make sense of this convoluted yet fascinating space, he switched his engineering job to become a crypto reporter and analyst.




