Ethereum Price Prediction: Assessing the possibility of a post-Merge rally
- Ethereum price navigates the sea of red after investors sold the Merge news.
- According to its supply distribution metric, investors may start buying ETH at a discount (lower price levels).
- Traders look forward to a buy signal after Ethereum’s ongoing consolidation period.

Ethereum price trades at $1,323 on Sunday, several days after sliding to $1,200. It was a surprise that the largest smart contracts token would give up most of its gains during and after the much-publicized Merge.
On-chain data shows a significant reduction in the Ethereum Supply. As investors sold, pressure built, forcing Ether to explore downhill levels from $2,000 to $1,200. Meanwhile, Ethereum price is consolidating losses, a move that could attract interest from investors – hoping for a bullish turnaround toward the end of the year.
Pressure eases on Ethereum’s supply distribution
On-chain data from Santiment shows that Ethereum’s supply tanked in the days leading to the Merge on September 15. Large volume investors mainly drove the urge to sell. For instance, addresses holding between 1,000 and 10,000 tokens shrunk to 5,523 from 5,634 on September 14.
Addresses with tokens between 10,000 and 100,000 stand at 1,179 after dropping from 1,196 in the same period. Overhead pressure on Ethereum hit its peak as addresses holding between 100,000 and 1 million ETH tokens plunged to 138, recorded on August 28.
 [15.54.24, 25 Sep, 2022]-637997083201635082.png)
Ethereum Supply Distribution
From the chart above, investors have eased the selling pressure. Minor upside movements are evident but not strong enough to support a sustained bullish breakout. As soon as Ethereum price validates support at $1,200, the same investors pushing the price down will return to make the most of the potential move back to $2,000.
Ethereum price’s daily chart concurs with the decreased selloff drive among investors by firmly holding marginally above $1,300. The OBV (On Balance Volume) indicator is moving horizontally at the midline, which implies consolidation will take precedence before Ethereum price decides the direction it will take going forward.
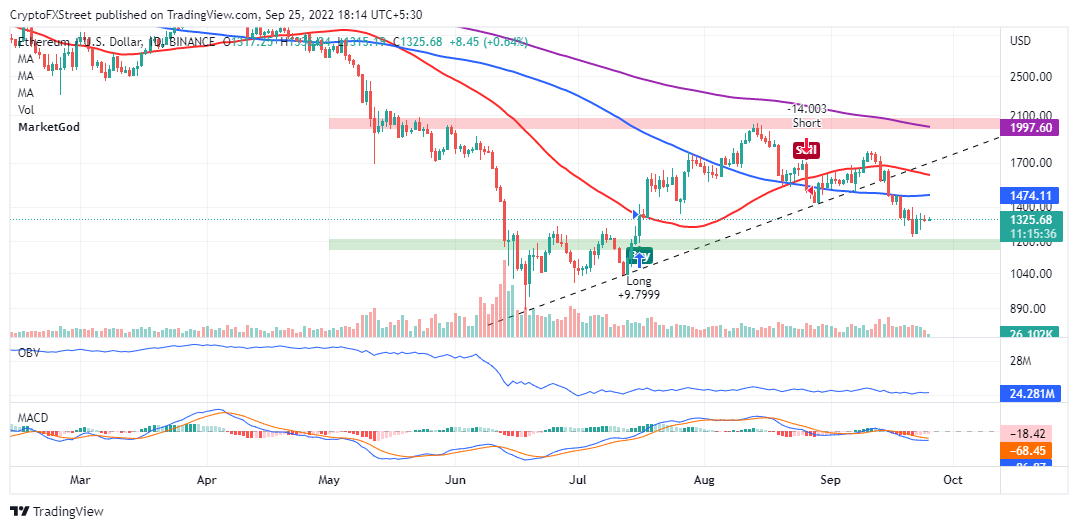
ETH/USD daily chart
The Moving Average Convergence Divergence (MACD) may add credibility to Ether’s optimistic outlook if it closes the gap to the mean line. Traders searching for entry positions should watch for the 12-day EMA (Exponential Moving Average – red) to step above the 26-day EMA (blue), validating the uptrend.
On the upside, Ethereum price might encounter a massive seller congestion zone at the 100-day SMA (Simple Moving Average – blue) – around $1,474. Other crucial targets sit at the 50-day SMA (red) – around $1,611 and the 200-day SMA (purple) – near $2,000.
Author

John Isige
FXStreet
John Isige is a seasoned cryptocurrency journalist and markets analyst committed to delivering high-quality, actionable insights tailored to traders, investors, and crypto enthusiasts. He enjoys deep dives into emerging Web3 tren



