Is the Ethereum price in a buy-low sell-high scenario?
- Ethereum price shows bullish divergence on the Relative Strength Index.
- The 8-day Exponential Moving Average has rejected the first bullish attempt after the recent decline.
- Invalidation of all uptrend possibilities depends on the $1,006 swing low holding as support.

Ethereum price shows early signs that the market bottom may not be in.
Ethereum price could decline further.
Ethereum price has traders wondering when a countertrend rally post decline will occur. Since September 12, the decentralized smart contract token has lost 30% market value. A penny-from-Eiffel style decline has occurred in the daily time frame, leaving traders to adopt a sidelined, cautious mentality.
Ethereum price currently auctions at $1305. A bullish divergence was spotted on the the 2-day chart when Ethereum tagged the previous resistance zone at $1,220. The bulls then rallied 10% into the $1,340 barrier, where the 8-Exponential Moving Average (EMA) is positioned. The EMA has rejected the first bullish attempt to rally higher, an early warning for investors with a buy-low-sell-high mentality that a secure market bottom may not be in place.
If the bulls cannot hurdle the $1340 barrier, placing an entry will be ill-advised. The ETH price could witness a further decline to wipe out July 16 liquidity level of just under $1,200. Investors should keep in mind that due to the steep decline, the safest invalidation for any uptrend move should be placed under the July 12 Swing low at $1,006.
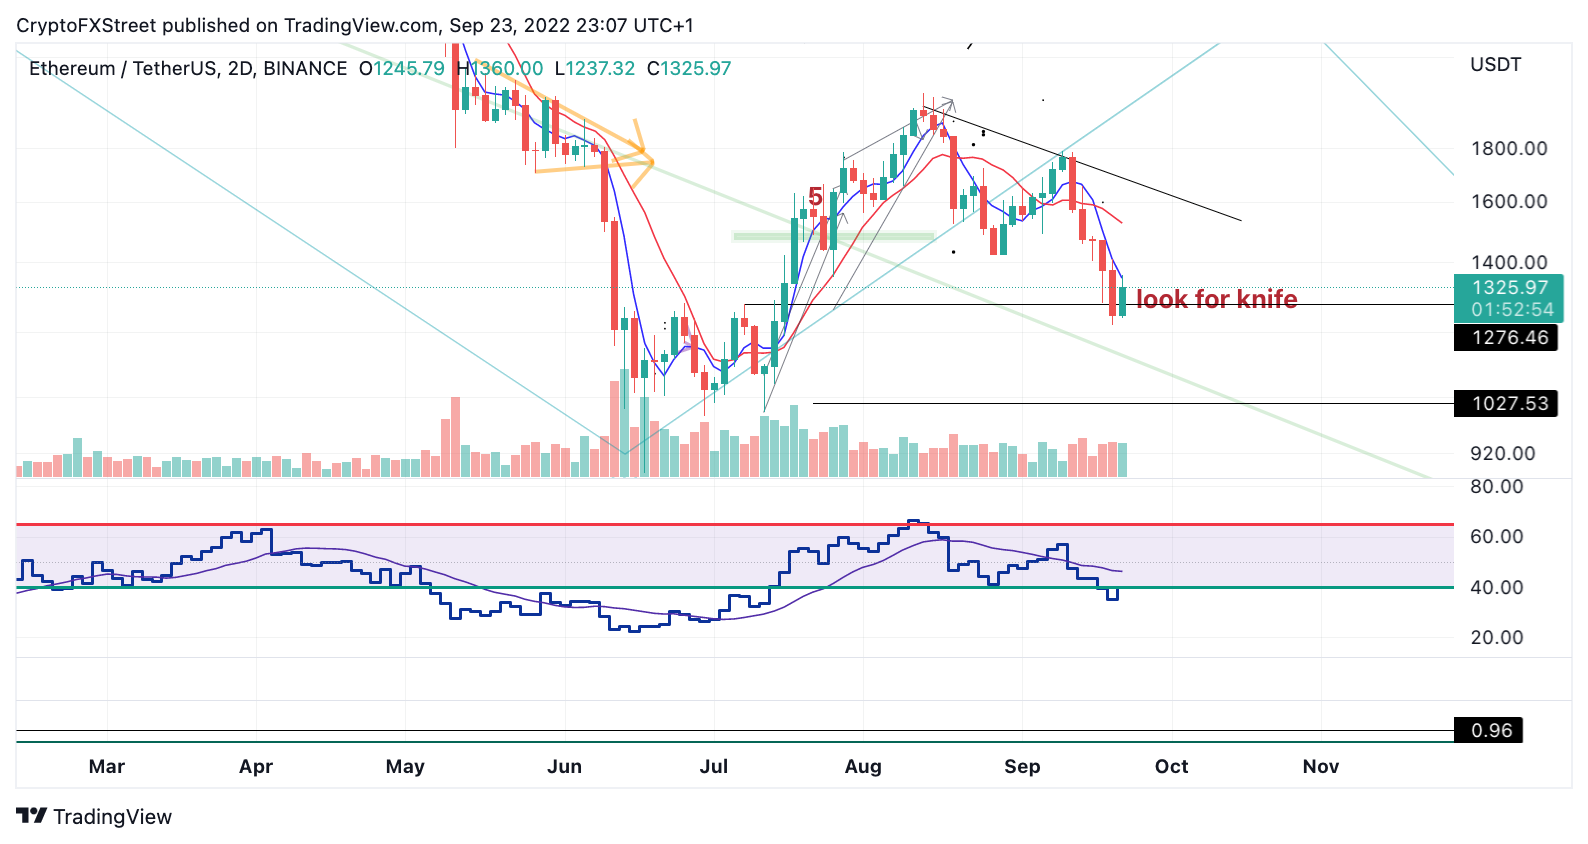
ETH USDT 2-Day Chart
In the following video, our analysts deep dive into the price action of Ethereum, analyzing key levels of interest in the market. -FXStreet Team
Author

Tony M.
FXStreet Contributor
Tony Montpeirous began investing in cryptocurrencies in 2017. His trading style incorporates Elliot Wave, Auction Market Theory, Fibonacci and price action as the cornerstone of his technical analysis.


