Ethereum price in danger of a 15% pullback as ETH supply in loss hits 4-month high
- Ethereum price’s early week rebound stalls at $1,340.
- Justin Bons, the founder of Cyber Capital, reckons that no ETH transaction has been stopped or censored since the Merge.
- A break below the 50-day SMA on the eight-hour could drag ETH price closer to validating a falling triangle breakout.
- Ethereum supply in loss rises to 52 million, hinting at a bullish price move.

Ethereum price seems relatively unchanged on Tuesday after bulls propelled it to $1,340 on Monday. Although the pioneer smart contracts token managed to climb above the 50-day SMA (Simple Moving Average), red, at $1,315, its momentum faded before confirming support above $1,340.
Ethereum price is in a dilemma because trading below the 50-day SMA may validate a falling triangle pattern. Conversely, the second-largest cryptocurrency could extend its early week bullish breakout to tag $1,521 and possibly close the gap to $2,000.
No Ethereum transactions have been stopped
Ethereum users like Justin Bons, the founder of Cyber Capital, are taking a stand against allegations that the PoS (proof-of-stake) network is prone to censorship from outside authorities following the Merge software update in September.
Bons reckons that claims censorship is occuring made by “certain Bitcoiners” are not in good faith – and that not a single ETH transaction has so far been stopped due to OFAC (Office of Foreign Assets Control) sanctions.
“Even with 50% OFAC compliance, a non-compliant ETH TX will be confirmed within 30 sec! Compared to BTC’s more variable 10min!” Bons explained to his followers on Twitter.
“This means that a very small minority of validators/miners can counter such censorship over both ETH & BTC! Easily less than 1% can prevent censorship,” the fund manager continued.
The state of the Ethereum network has continued to improve since the Merge. Last week, FXStreet reported that ETH had become nondeflationary, so the price may soon start trending to the upside.
Ethereum price risks sliding 15% below the breakout point
If validated, a falling triangle pattern on the eight-hour chart could decree a 15.22% decline in Ethereum price. However, this validation will not come easy, keeping in mind support at the 50-day SMA.
The RSI (Relative Strength Index) shows that sellers are fighting to regain control, but bulls seem adamant. Traders looking for short positions must wait for ETH to slip below the moving average before triggering their orders.
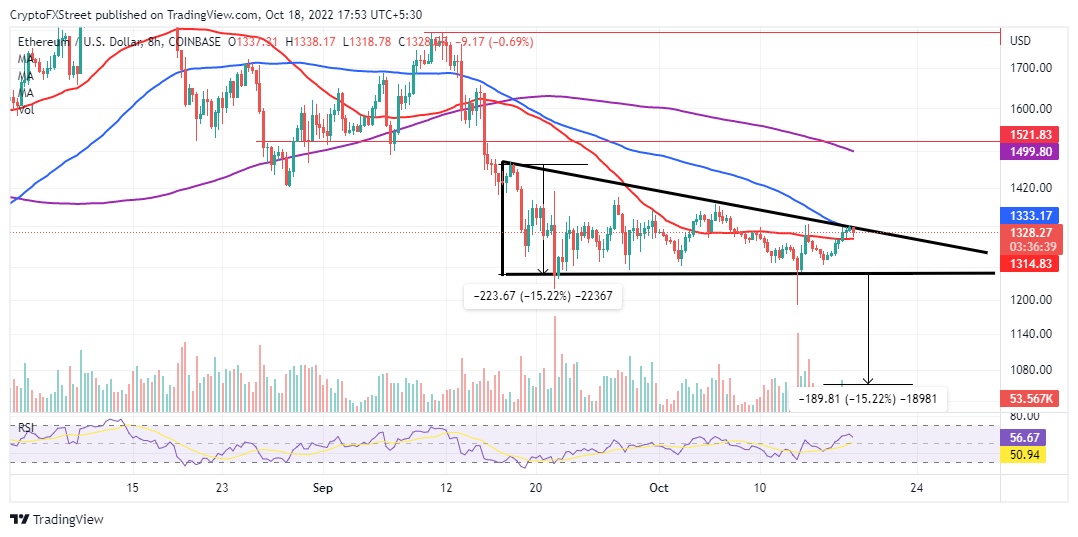
ETH/USD eight-hour chart
On the other hand, the 15.22% triangle breakout price target will only be activated if Ethereum price cracks below the horizontal (x-axis) support at $1,250. Nevertheless, such a move could see ETH revisit downhill levels at $1,057 and $1,000, respectively, before rebounding to regain the ground to $2,000.
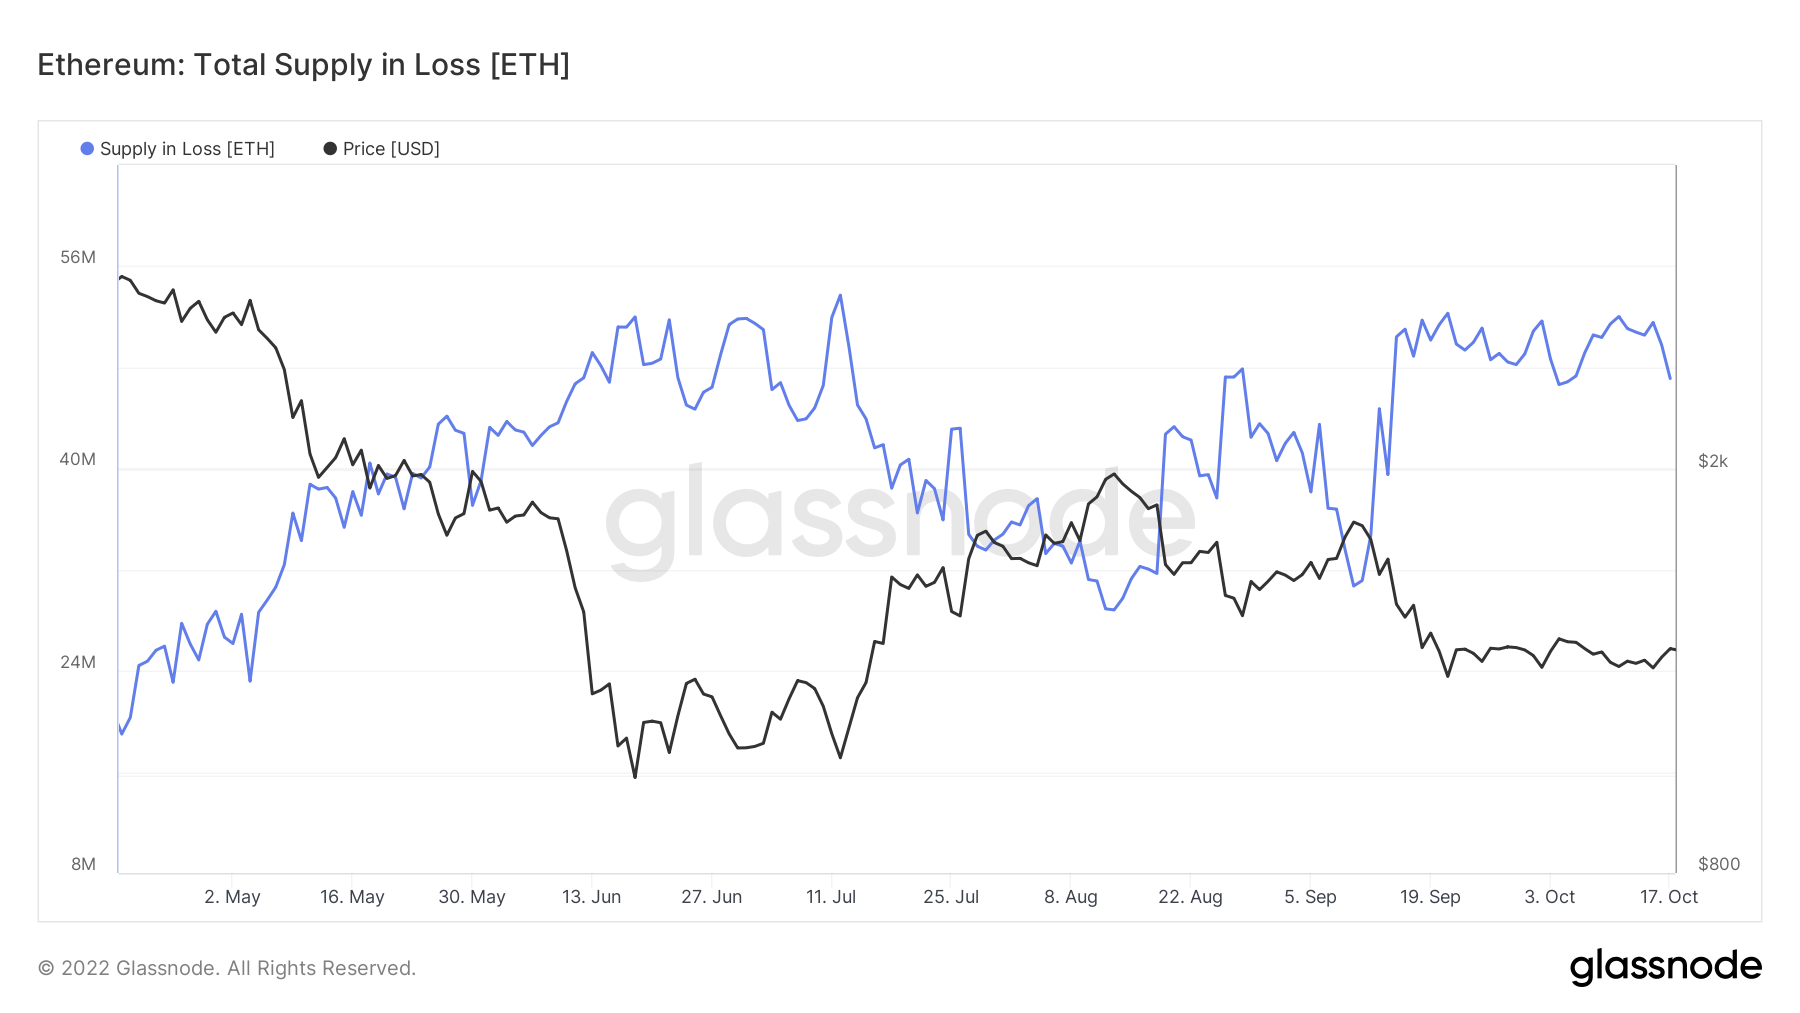
Ethereum Supply In Loss
The total supply of ETH tokens in loss rallied to approximately 52 million from the 30 million recorded on September 30. According to Glassnode, this on-chain metric tracks the number of tokens whose price was higher than the current price at the time they last moved.
As observed from the chart, Ethereum price is negatively correlated with the total supply in loss. In other words, as supply in loss increases, Ethereum price drops. Therefore, a bullish move could be awaiting Ethereum price if this on-chain metric extends the ongoing pullback from its four-month high.
Ethereum price remains bound to this range with no directional bias [Video]
Author

John Isige
FXStreet
John Isige is a seasoned cryptocurrency journalist and markets analyst committed to delivering high-quality, actionable insights tailored to traders, investors, and crypto enthusiasts. He enjoys deep dives into emerging Web3 tren


