Ethereum Price Forecast: ETH futures market seems overheated

Ethereum price today: $2,600
- Ethereum price extends decline after rejection around the $2,700 level on Monday.
- ETH’s Estimated Leverage Ratio has increased to the highest since early July, raising the chances of a short squeeze.
- US spot Ethereum ETFs recorded a mild outflow of $20.80 million on Monday.
Ethereum (ETH) declines for a second consecutive day on Tuesday after facing rejection around the $2,700 level the previous day. The downward move was supported by a mild outflow of over $20 million in US spot Ethereum Exchange Traded Funds (ETFs). Additionally, the high Estimated Leverage Ratio in the ETH futures market indicates an increased likelihood of a short-squeeze scenario.
Ethereum might have a short-squeeze scenario
According to CryptoQuant data, Ethereum could face a short-squeeze risk as the Estimated Leverage Ratio (ELR) increases and trades at 0.39, the highest level since early July. This rise in the metric indicates that more traders are opening high-leverage short positions amid a bearish sentiment. This rising ELR, which reflects an overall price downtrend, suggests that the futures market is overheated, leaving Ethereum vulnerable to a potential short-squeeze event that could trigger impulsive buying (liquidating over leverage short positions) and significantly drive up its price if there’s an unexpected rise.
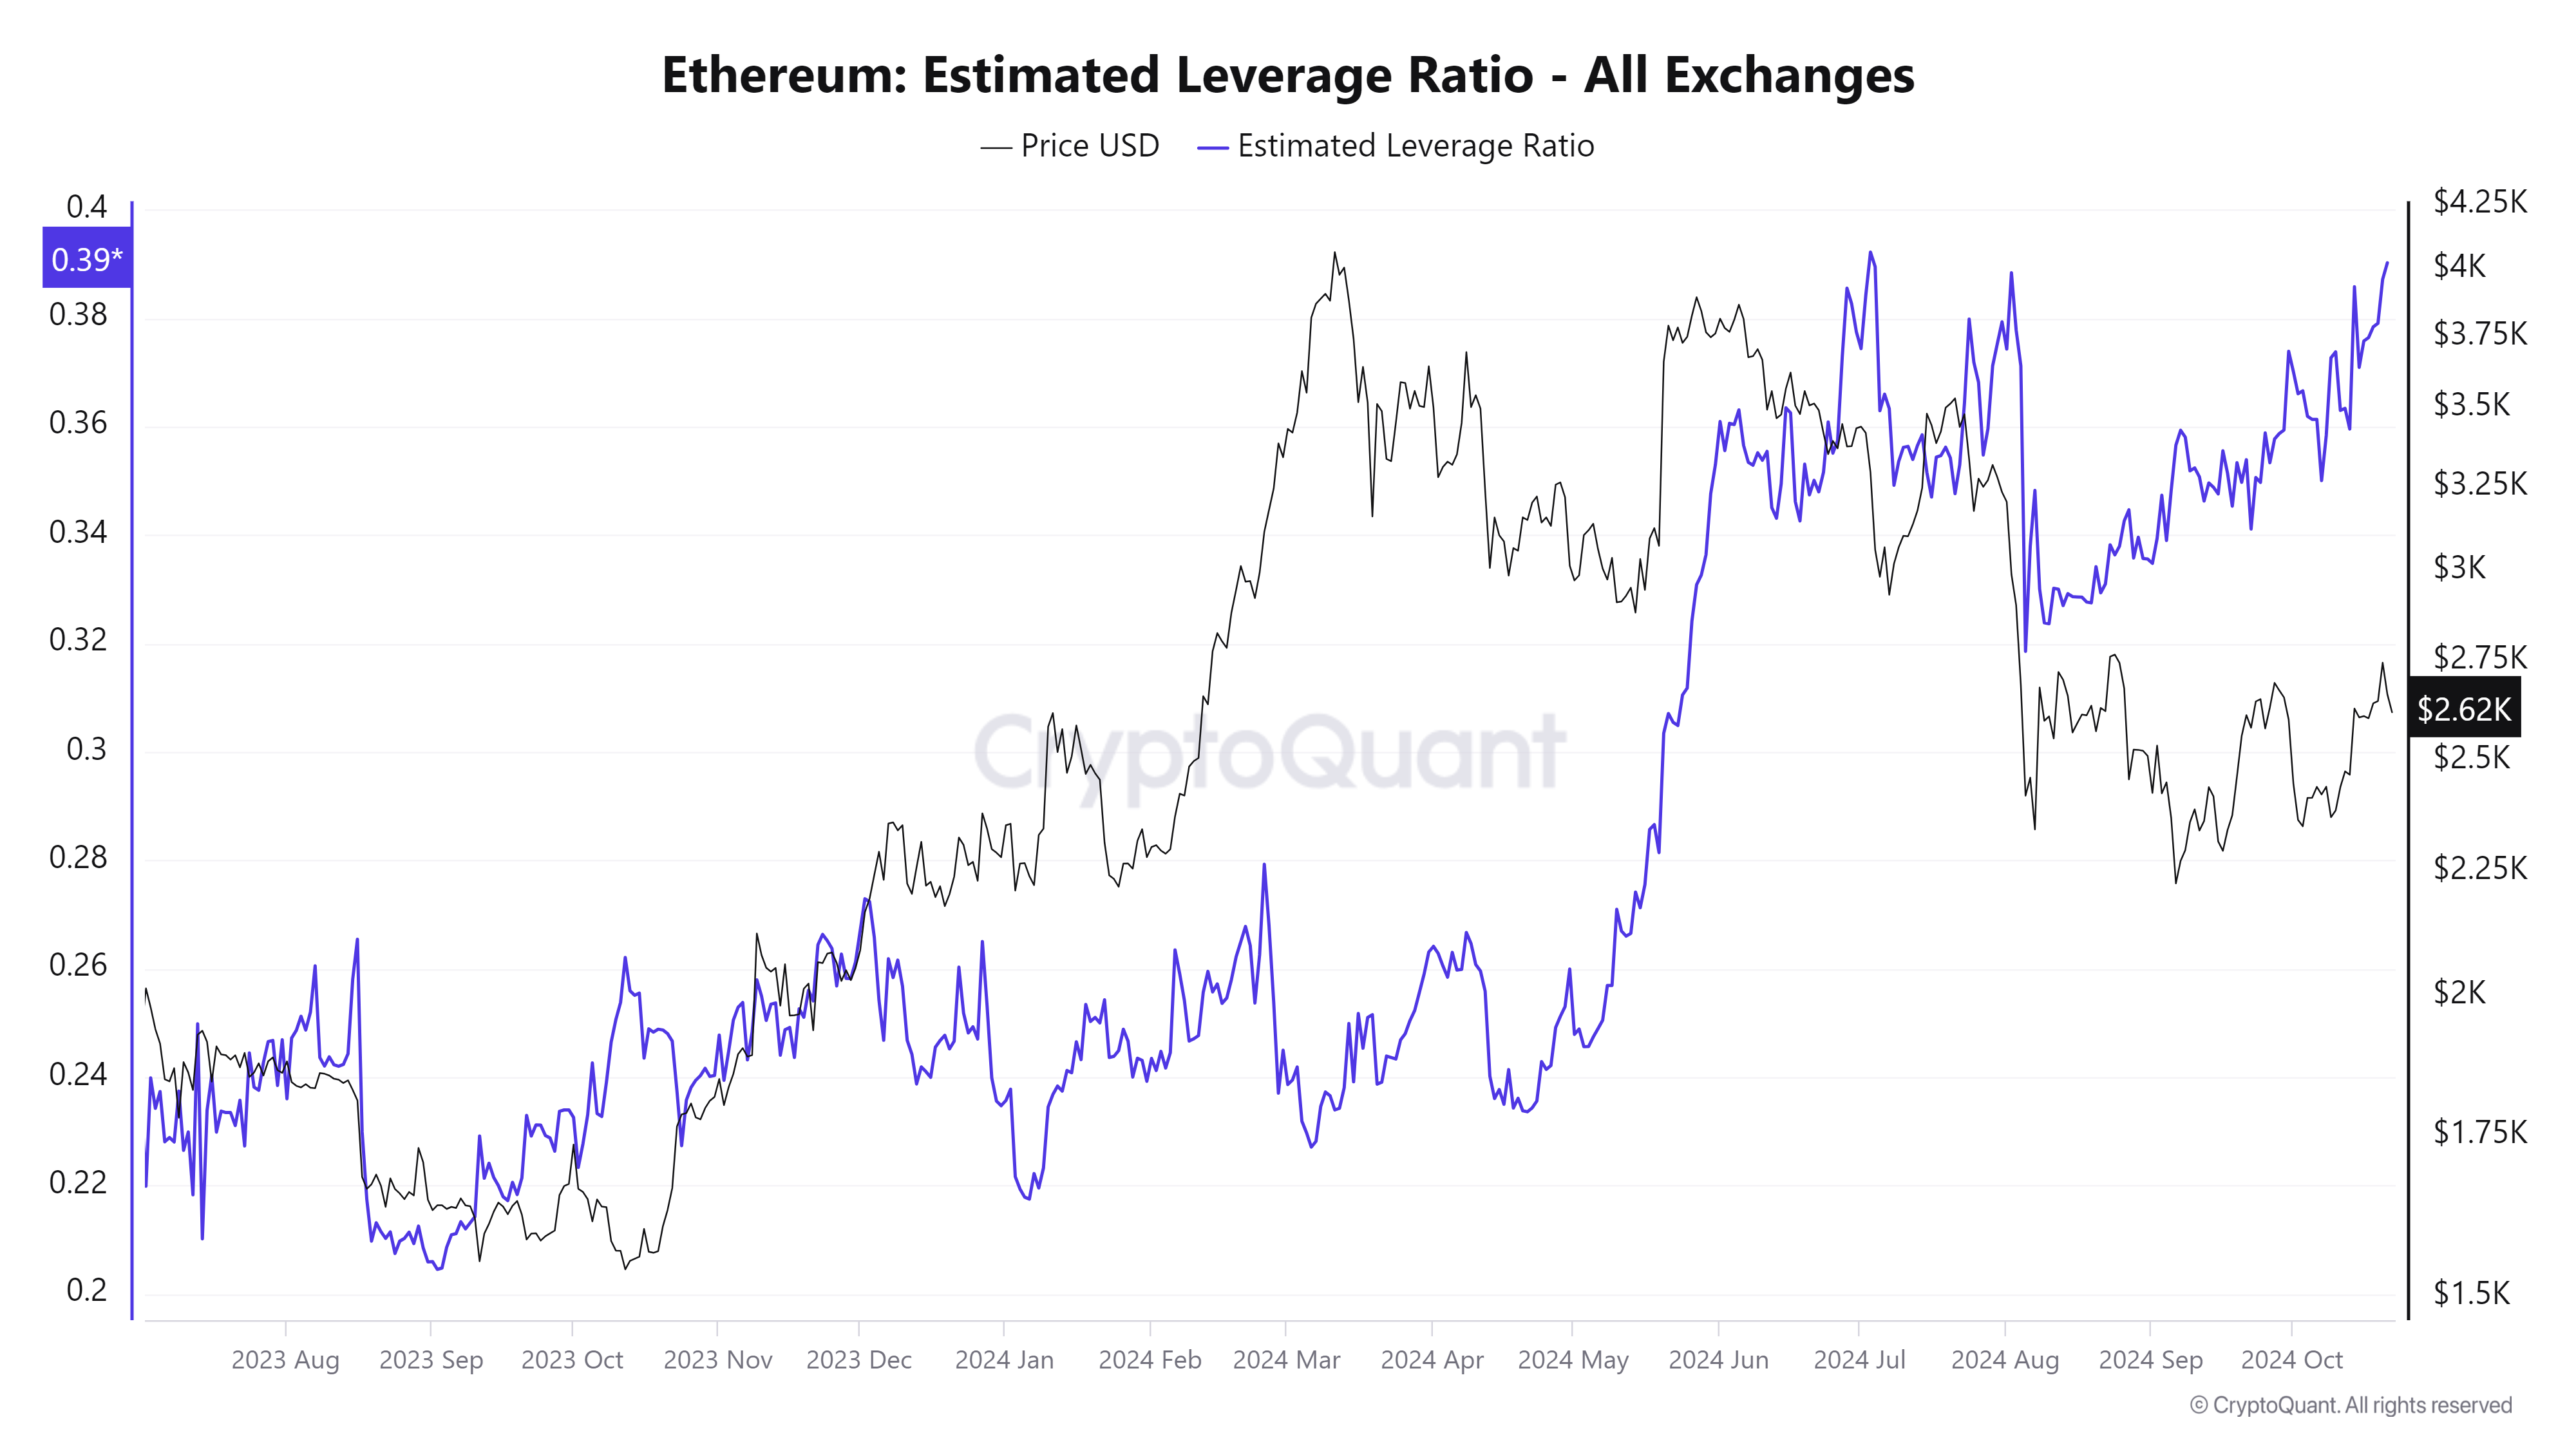
Ethereum Estimated Leverage Ratio chart. Source: CryptoQuant
Institutional flow fell slightly at the start of this week. According to Coinglass data, the US spot Ethereum ETFs recorded a mild outflow of $20.80 million on Monday.

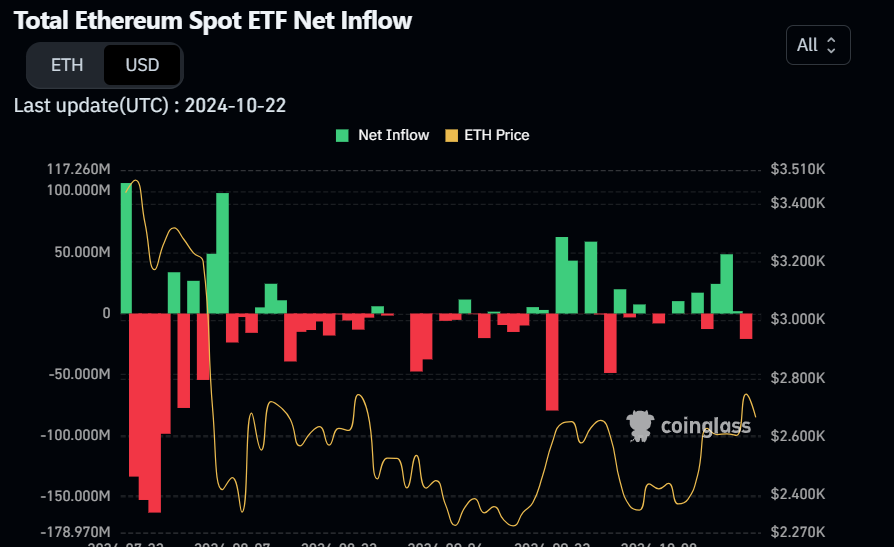
Total Ethereum Spot ETF Net inflow chart. Source: Coinglass
CryptoQuant’s Ethereum Coinbase Premium Index data shows signs of weakness and remains below neutral levels. This indicator measures the price gap between Coinbase Pro (USD pair) and Binance (USDT pair) and serves as a key metric for assessing the behavior of large-wallet investors as it reflects whale accumulation trends. This is significant because Coinbase Pro is a primary gateway for institutional cryptocurrency purchases.
In the case of Ethereum, the metric currently stands at -0.039, below its neutral level of zero. For Ethereum’s price to rally, the metric must rise above its neutral value of zero.
-638652067321778644.png)
Ethereum Coinbase Premium Index chart. Source: Cryptoquant
Ethereum Price Forecast: Shows signs of weakness
Ethereum faced resistance around its descending trendline (drawn by joining multiple highs from the end of May) on Monday and declined 2.9% on the day. At the time of writing on Tuesday, it continues its decline, trading around $2,600.
If ETH continues its retracement, it could decline further to retest its daily support level of around $2,461.
The Relative Strength Index (RSI) momentum indicator reads 56 and points downwards on the daily chart after rejection around its overbought level of 70, indicating weakness in bullish momentum. If RSI continues to decline and closes below its neutral level of 50, it could lead to a sharp decline in Ethereum price.
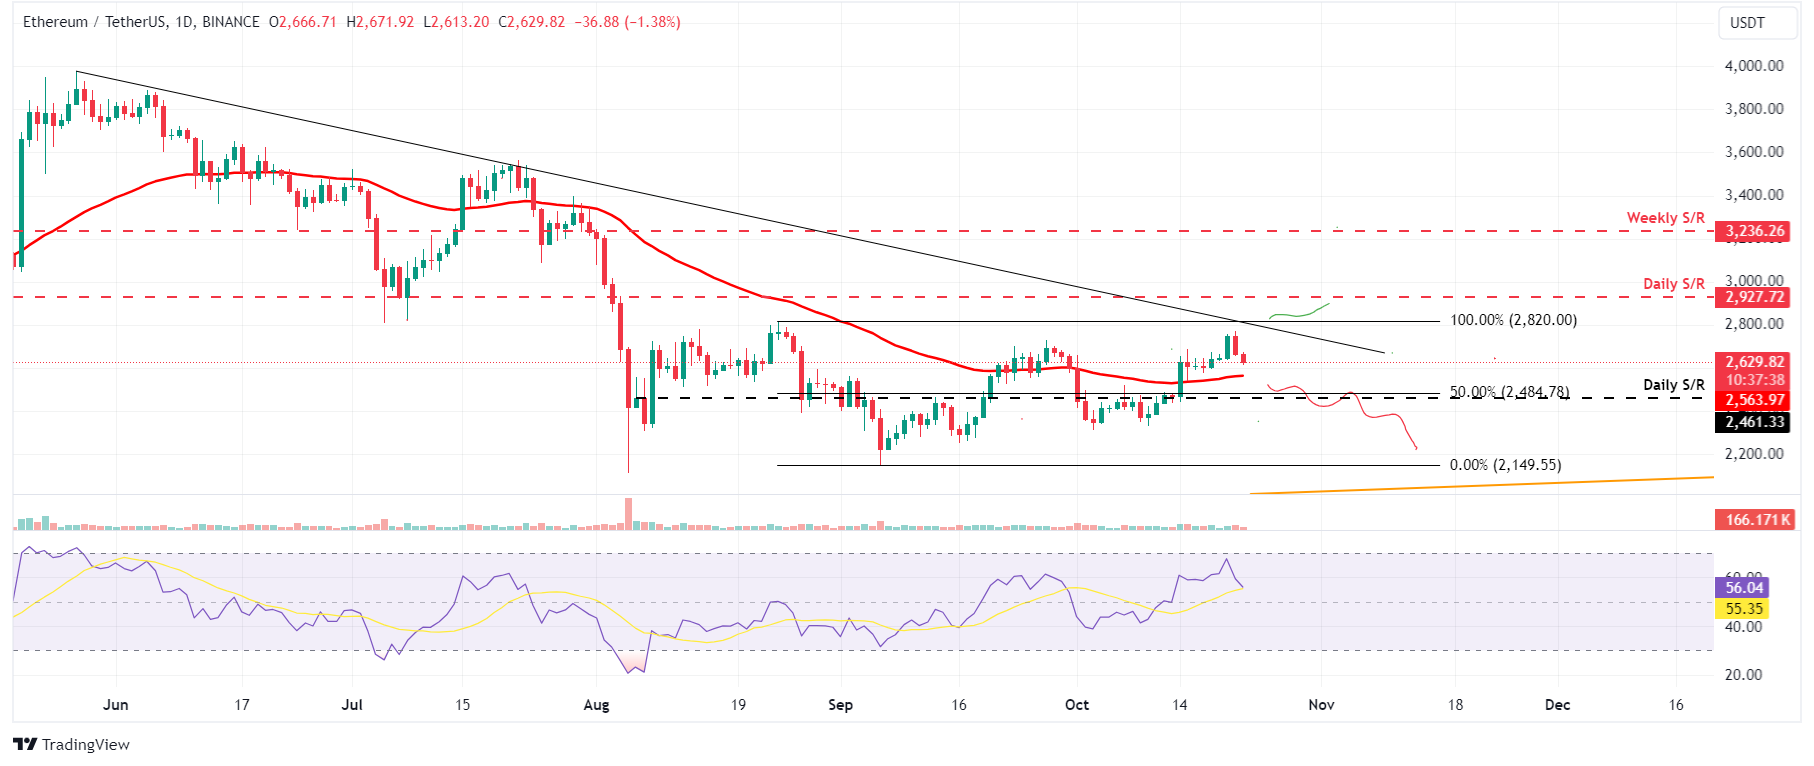
ETH/USDT daily chart
On the contrary, if ETH breaks the descending trendline and closes above $2,820, Ethereum’s price could rally to retest its next daily resistance at $2,927.
Ethereum FAQs
Ethereum is a decentralized open-source blockchain with smart contracts functionality. Its native currency Ether (ETH), is the second-largest cryptocurrency and number one altcoin by market capitalization. The Ethereum network is tailored for building crypto solutions like decentralized finance (DeFi), GameFi, non-fungible tokens (NFTs), decentralized autonomous organizations (DAOs), etc.
Ethereum is a public decentralized blockchain technology, where developers can build and deploy applications that function without the need for a central authority. To make this easier, the network leverages the Solidity programming language and Ethereum virtual machine which helps developers create and launch applications with smart contract functionality.
Smart contracts are publicly verifiable codes that automates agreements between two or more parties. Basically, these codes self-execute encoded actions when predetermined conditions are met.
Staking is a process of earning yield on your idle crypto assets by locking them in a crypto protocol for a specified duration as a means of contributing to its security. Ethereum transitioned from a Proof-of-Work (PoW) to a Proof-of-Stake (PoS) consensus mechanism on September 15, 2022, in an event christened “The Merge.” The Merge was a key part of Ethereum's roadmap to achieve high-level scalability, decentralization and security while remaining sustainable. Unlike PoW, which requires the use of expensive hardware, PoS reduces the barrier of entry for validators by leveraging the use of crypto tokens as the core foundation of its consensus process.
Gas is the unit for measuring transaction fees that users pay for conducting transactions on Ethereum. During periods of network congestion, gas can be extremely high, causing validators to prioritize transactions based on their fees.
Author

Manish Chhetri
FXStreet
Manish Chhetri is a crypto specialist with over four years of experience in the cryptocurrency industry.



