Ethereum Price Forecast: ETH bulls drained after hitting a barrier at $360
- Ethereum recovered significantly from last week’s losses to $310 but hit a snag at $360.
- ETH/USD is in for a challenging ride to $400; IntoTheBlock’s IOMAP reveals several resistance zones.
- ETH/USD is sitting on a healthy support range running from $346 to $357, according to the IOMAP model.

Ethereum recently revisited support at $310. The smart contracts token bounced back upwards despite calls for losses as far as $250. The weekend session has been yielding for Ethereum because buyers managed to bring down the resistance at $350. At the time of writing, Ether is doddering at $357 amid a building bearish momentum.
Ethereum 2.0 in the final stages ahead of the anticipated launch
The much-awaited Ethereum 2.0 upgrade is in its final lap before the grand launch. In a recent interview with CoinDesk, Raul Jordan, Prysmatic Labs lead developer, said that the protocol is ready, but final touches are still ongoing. In other words, developers are concentrating on providing good documentation as well as a good user experience.
At that time, it’s all hands on deck to just have good documentation, good user experience, fix up security holes [and] basically prepare for launch. That’s where we are today if all remains on track.
Ethereum's journey to $400 is an uphill task
Analysts and cryptocurrency enthusiasts believe that the release of ETH 2.0 will act as a significant boost to Ethereum in terms of growth. Trading above $500 remains the most realistic prediction, but when you consider the magnitude and the impact of the new protocol, eyes start to open up towards $1,000.
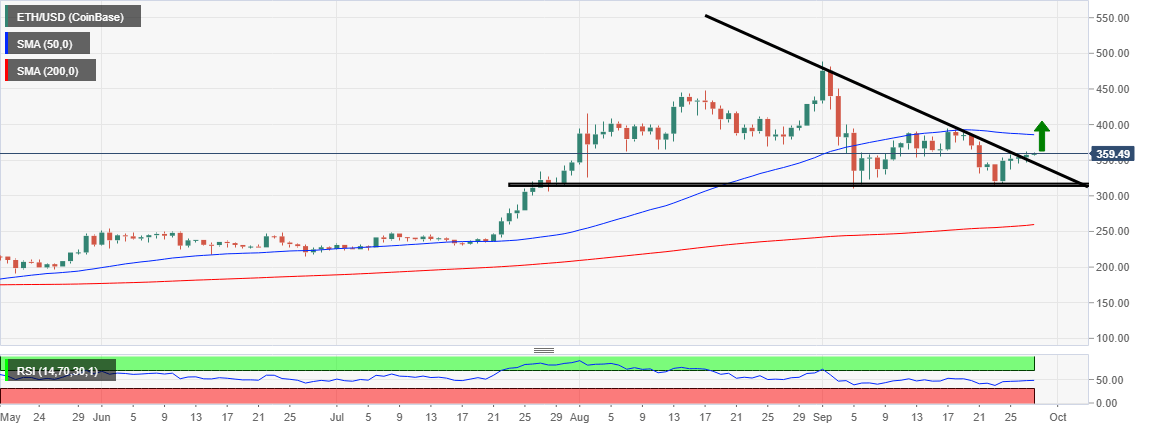
At the time of writing, Ether is teetering at $357. The momentum appears to have stalled under $360 despite the breakout above the descending triangle pattern. The Relative Strength Index (RSI) in the 4-hour range moves horizontally at the midline, suggesting that consolidation will take precedence in the near term.
Ethereum bulls must take down the hurdle at $360 as soon as possible to open the way for gains heading to $400. However, more resistance is envisaged at $380, the 50 Simple Moving Average (SMA) in the 4-hour timeframe and $400.
ETH/USD 4-hour chart
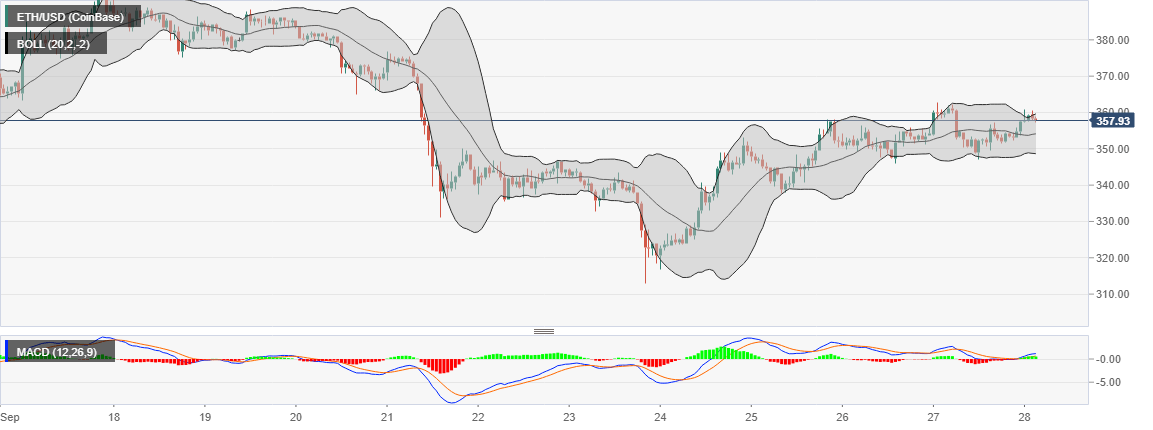
Looking at the hourly chart, the Bollinger Bands highlight the possibility of consolidation taking precedence in the coming sessions. As the bands begin to squeeze, volatility will start to mount ahead of a breakout. The middle curve is in line to offer support following the temporal rejection at $360.
The Moving Average Convergence Divergence (MACD) in the same hourly range shows that Ethereum is in the bulls' hands. The MACD is settling in the positive region and a bullish divergence above it emphasizes that buyers are in the driver’s seat.
ETH/USD 1-hour chart
IntoTheBlock’s IOMAP model confirms that Ethereum has the potential to hit highs above $400. However, the breakout is bound to face several challenging hurdles before materializing. For instance, the most vigorous resistance lies between $358 and $369. Here, nearly 515,000 addresses previously bought 2.88 million Ether. The resistance of almost the same magnitude lies between $369 and $390.
Ethereum IOMAP chart
-637368632359712444.png)
On the flip side, the smart contracts giant sits on an area with immense support, as highlighted by the IOMAP model between $346 and $357. In this range, 603,230 addresses previously purchased 10.56 million ETH. Ethereum must hold above this zone; otherwise, losses below it could extend to $300.
Consequently, investors are holding dearly to their ETH ahead of the new protocol launch. According to Santiment, a leading on-chain analytics platform, the amount of ETH held by top-non exchange addresses hit 12.58 million, the highest since July 2016. Note that, Ethereum started a rally almost a year later in 2017, where it hit an all-time high of $1,300 in January 2018. As these top-non exchange addresses increase their holdings, there is a growing potential that Ethereum will soon start to rally.
Ethereum held by top non-exchange addresses chart
 [07.14.46, 28 Sep, 2020]-637368633021146791.png)
Looking at the other side of the picture
Ethereum is indeed nurturing a bullish momentum towards $400. The technical analysis highlighted resistance at $360. IntoTheBlock suggests that the path to $400 will be challenging mainly because of the hurdles in the ranges; $358 - $369, $369 - $380 and $380 - $390. If rejection at $360 fails to hold above the Bollinger Band middle curve (1-hour), Ethereum could extend the bearish leg to $300, mostly if support between $346 and $357 is shattered.
Author

John Isige
FXStreet
John Isige is a seasoned cryptocurrency journalist and markets analyst committed to delivering high-quality, actionable insights tailored to traders, investors, and crypto enthusiasts. He enjoys deep dives into emerging Web3 tren


