Ethereum Price Analysis: ETH faces strong resistance wall at $360
- Decentralized finance (DeFi) growth has resulted in increased activity and the market cap of the network.
- The network’s hashrate has managed to keep pace with the difficulty.

The rise of DeFi creates opportunities and issues in the Ethereum network
Ethereum sees a steady rise in activity and market capitalization, all thanks to the ongoing DeFi boom. Prices of Ether have also recovered from its 2020 lows. While this had positive effects on on-chain activity, it has also caused significant inflation in gas prices. It appears that DeFi is creating both opportunities and issues in the space.
Ethereum gas fees have reached all-time highs due to the DeFi applications built on the network. Sophisticated investors are willing to pay high gas costs to ensure that their transactions are successful. As a result, ETH gas prices have surged more than 20x this year, as per a Forbes report. This has made it difficult for users who use the platform to take advantage of other DApps.
Non-DeFi businesses that rely on gas fees have been forced to shut down in recent times. For instance, UniLogin had to suspend operations because high gas fees meant that it had to pay $130 to onboard new users at one point. Many decentralized entities simply can’t survive if each transaction or action on the network costs a lot.
ETH/USD daily chart
-637366868910884184.png)
Ethereum bounced up from the $320 support line this Thursday and has gone up to $350 over three days. The price is currently negotiating with resistance at the downward trending line as it consolidates in the ascending triangle pattern. The MACD shows that market momentum is about to reverse from bullish to bearish,
ETH/USD hourly chart
-637366869219029928.png)
The hourly chart has been moving up in a massive ascending parallel channel. The lower boundary has consistently held firm and ensured that the price kept trending upward. However, things may change soon. The MACD has reversed from bullish to bearish, which may push the price below the channel.
Along with that, if the bulls do take control, two factors may prevent upward movement. Firstly, the SMA 200 is a significant barrier. Secondly, an upward trend will push the price into the overbought zone. This will inevitably lead to bearish price action.
ETH IOMAP
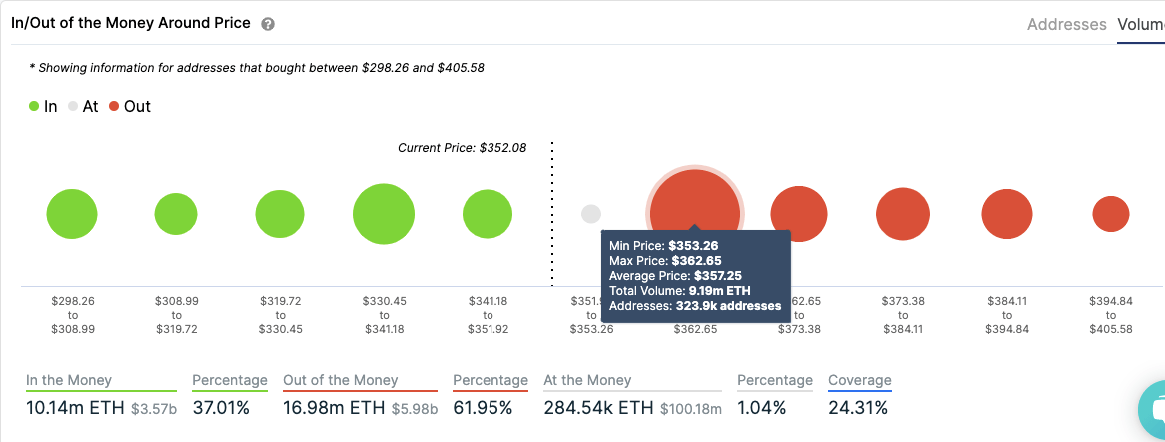
IntoTheBlock’s “In/Out of the Money Around Price” (IOMAP) model reveals there is a moderate supply barrier at $345 that’s holding the price up. In this level, 306.82k addresses are holding 1.88M ETH. On the upside, there is a strong resistance wall at $358, where 323.9k addresses have previously bought a whopping 9.19M ETH. If the buyers somehow manage to gain enough momentum to break above this level, the upside potential is hugely significant with moderate and weak resistance levels.
ETH on-chain and network metrics
#1 Holder Distribution
Santiment’s holder distribution chart shows a rise in the number of addresses with 100,000 - 1 million ETH. Over the last five days, the number of holders in this category rose from 159 to 165. This shows that the heavy hitters are consolidating their positions.
#2 Hashrate and Difficulty
Another interesting thing to look into is the difficulty and hashrate of the network.
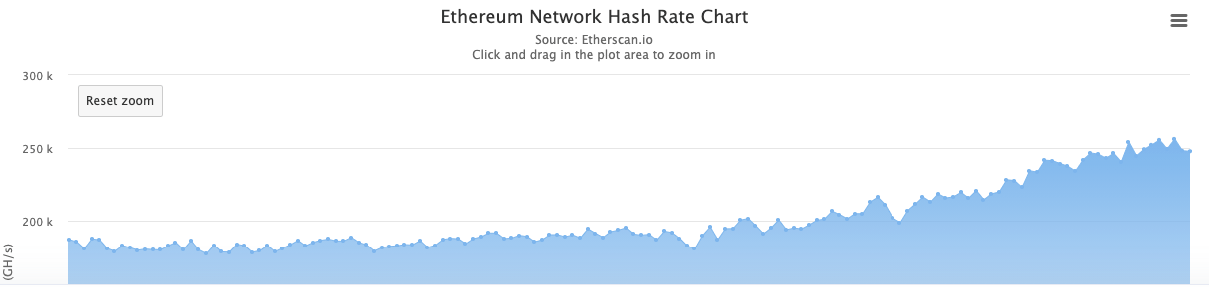
Ethereum difficulty has reached its highest levels since March 2019. Also, it looks like the hashrate has managed to keep up with the network difficulty.
This is a positive sign as it shows that the miners are motivated to work in the network's interest instead of packing things up and leaving the network. Hashrate is a critical metric that helps us gauge the health and well-being of the entire network. Higher the hashrate, the healthier the network.
#3 Miner balance
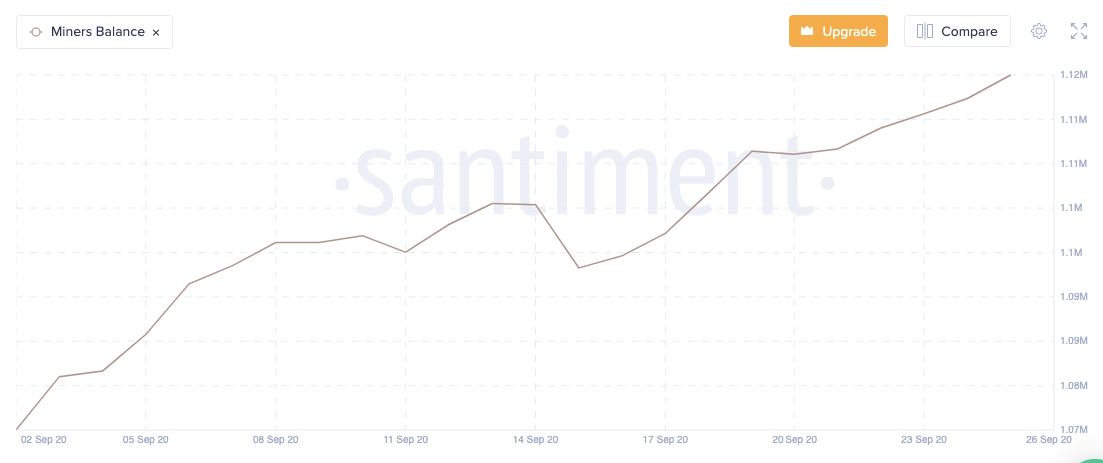
Santiment’s miner balance chart shows us that the amount of ETH balances belonging to miners has gone up from 1.08M on September 3rd to 1.12M on September 25. This is another positive sign as this tells us that the miners are not just selling off their block rewards. This reduces the token velocity and increases the overall perceived value of the Ethereum network.
Author

Rajarshi Mitra
Independent Analyst
Rajarshi entered the blockchain space in 2016. He is a blockchain researcher who has worked for Blockgeeks and has done research work for several ICOs. He gets regularly invited to give talks on the blockchain technology and cryptocurrencies.


