Ethereum Price Analysis: ETH upward momentum hits pause, but bulls aim higher
- Ethereum price stalls at the tactically important 50-day simple moving average (SMA), but overall price structure remains constructive.
- ETH consolidation is about releasing price compression generated by the sharp rebound from the May 23 lows.
- A downside break in price will discover overwhelming support at the February 20 high at $2,042.

Ethereum price has not recovered the relative strength that dominated the April-May period, but the response to the largest weekly loss of 41.44% has been constructive. Until ETH can gain sustainable price traction above the 50-day SMA, Ethereum price will be clouded with investor skepticism.
Ethereum price struggles to separate from broader crypto weakness
Ethereum price rallied just over 50% from the May 19 low at $1,900 before printing a new correction low on May 23. The new low was followed by a 70% bounce at the May 26 high. A bullish hammer candlestick on the 12-hour ETH chart initiated the rebound on May 23, and it was accompanied by above-average volume after reaching an oversold reading on the daily Relative Strength Index (RSI). Moreover, the May 23 undercut of the May 19 low has put Ethereum price in place for a double bottom pattern with a trigger price of $3,000.
The consecutive quick rebounds have frustrated any bearish narrative and have built up price compression that needs to be released by removing the weak ETH holders through pullbacks, such as today. Once complete, Ethereum price will be unfettered to test the double bottom trigger price.
A breakout above the double bottom will quickly discover resistance at the 61.8% Fibonacci retracement of the May decline at $3,369. If the rally continues, Ethereum price will be introduced to minor resistance at the 78.6% retracement at $3,815 before launching an assault on the all-time high at $4,384.
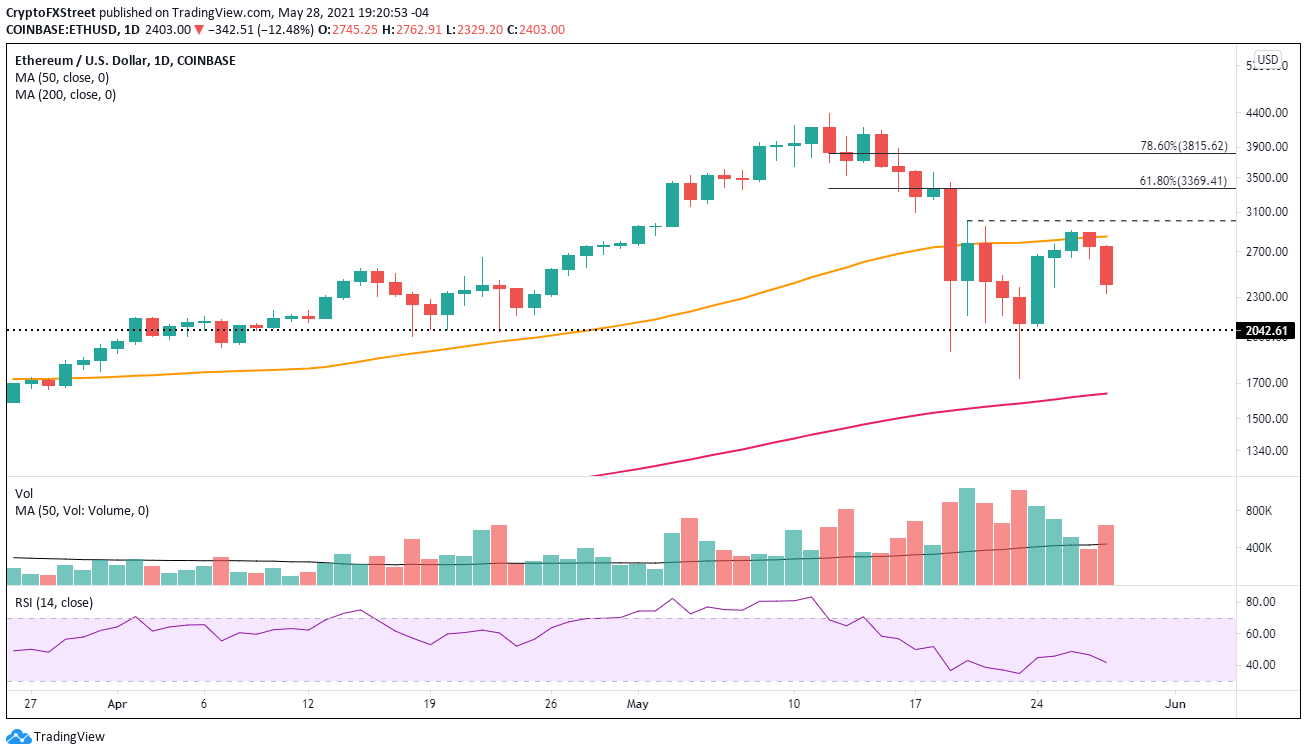
ETH/USD daily chart
An aggressive renewal of selling in the cryptocurrency complex may derail the relatively positive outlook for Ethereum price. The most crucial level of support is the February 20 high at $2,042, a price that has been resistance and support in April and May on an intra-day and closing basis.
If selling does not halt, the May 23 low will offer modest support, but the vital level is the strategically important 200-day SMA at $1,638. It should motivate prominent investors and institutions to begin accumulating in size.
Conveying a bullish message for Ethereum price is the Santiment Market Value Realized Value (MVRV) metric. The current metric reading is negative despite the 70% bounce in ETH, indicating that the smart contracts giant remains undervalued.
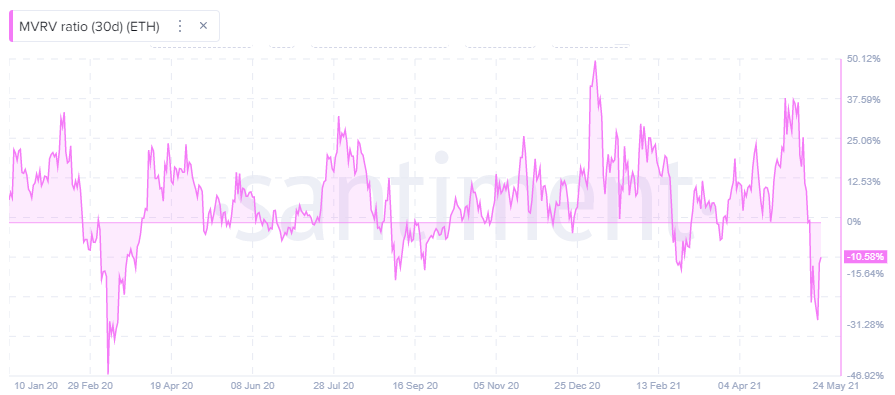
ETH MVRV metric
In April and May, Ethereum price displayed relative strength by assuming leadership for the entire crypto market. The underlying fundamentals driving that performance have not changed, and ETH is just beginning to capture the interest of institutional investors.
Author

Sheldon McIntyre, CMT
Independent Analyst
Sheldon has 24 years of investment experience holding various positions in companies based in the United States and Chile. His core competencies include BRIC and G-10 equity markets, swing and position trading and technical analysis.


