Ethereum funding rate drops to the floor, what to expect from ETH price?
- Ethereum funding rates hit a fourteen month low, similar to short squeeze setup in July 2021.
- The funding rate setup is similar to July 2021, ahead of the massive short-squeeze in Bitcoin and Ethereum.
- Analysts identify major resistance for Ethereum uptrend between $1,750 and $2,000 level.

Ethereum funding rates are similar to the level observed in July 2021, ahead of a massive rally in Bitcoin and ETH. The funding rate – the difference between the perpetual contract prices and short prices of an asset – is a key metric to predict crypto trend reversals.
Also read: Ethereum price: This price can unlock ETH bullish potential post Merge
Ethereum funding rate turns negative, this is what it means
Ethereum funding rates hit a fourteen month low. This metric is used to force convergence of prices between the perpetual contract and the underlying asset. Funding rates represent the payment made by short to long traders or by long to short traders. It is calculated on the difference between the perpetual futures contract price and the spot price of an asset.
Currently the Ethereum funding rate is negative, so short traders are paying for longs, as the metric hits a fourteen month low. The last time funding rates hit this level was in July 2021, just before a huge short-squeeze in Bitcoin and Ethereum prices.
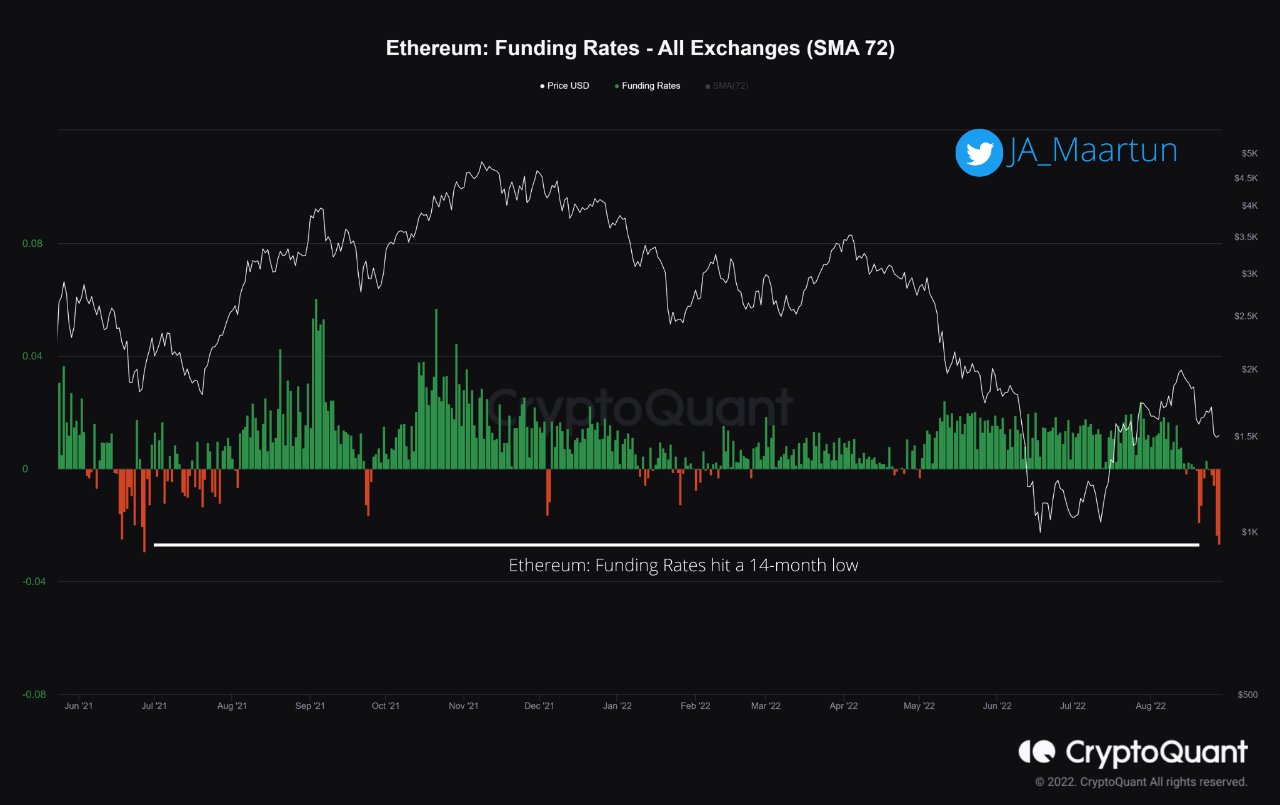
Ethereum Funding Rates- All exchanges
Negative funding is considered a result of traders hedging their spot exposure to be delta neutral. Maartunn, a crypto analyst argues that the upcoming ETH 2.0 Merge is the driver of this behavior among traders. The analyst therefore argues that Ethereum could be setting up for a short squeeze similar to July 2021.
Ethereum faces resistance at $1,750
Pentoshi, a pseudonymous crypto analyst and trader believes Ethereum price faces resistance at $1,750 and $2,000. These price levels are key to Ethereum’s sustained uptrend. While funding rates indicate that Ethereum is ready to breakout, the altcoin needs to break past resistance at $1,750.
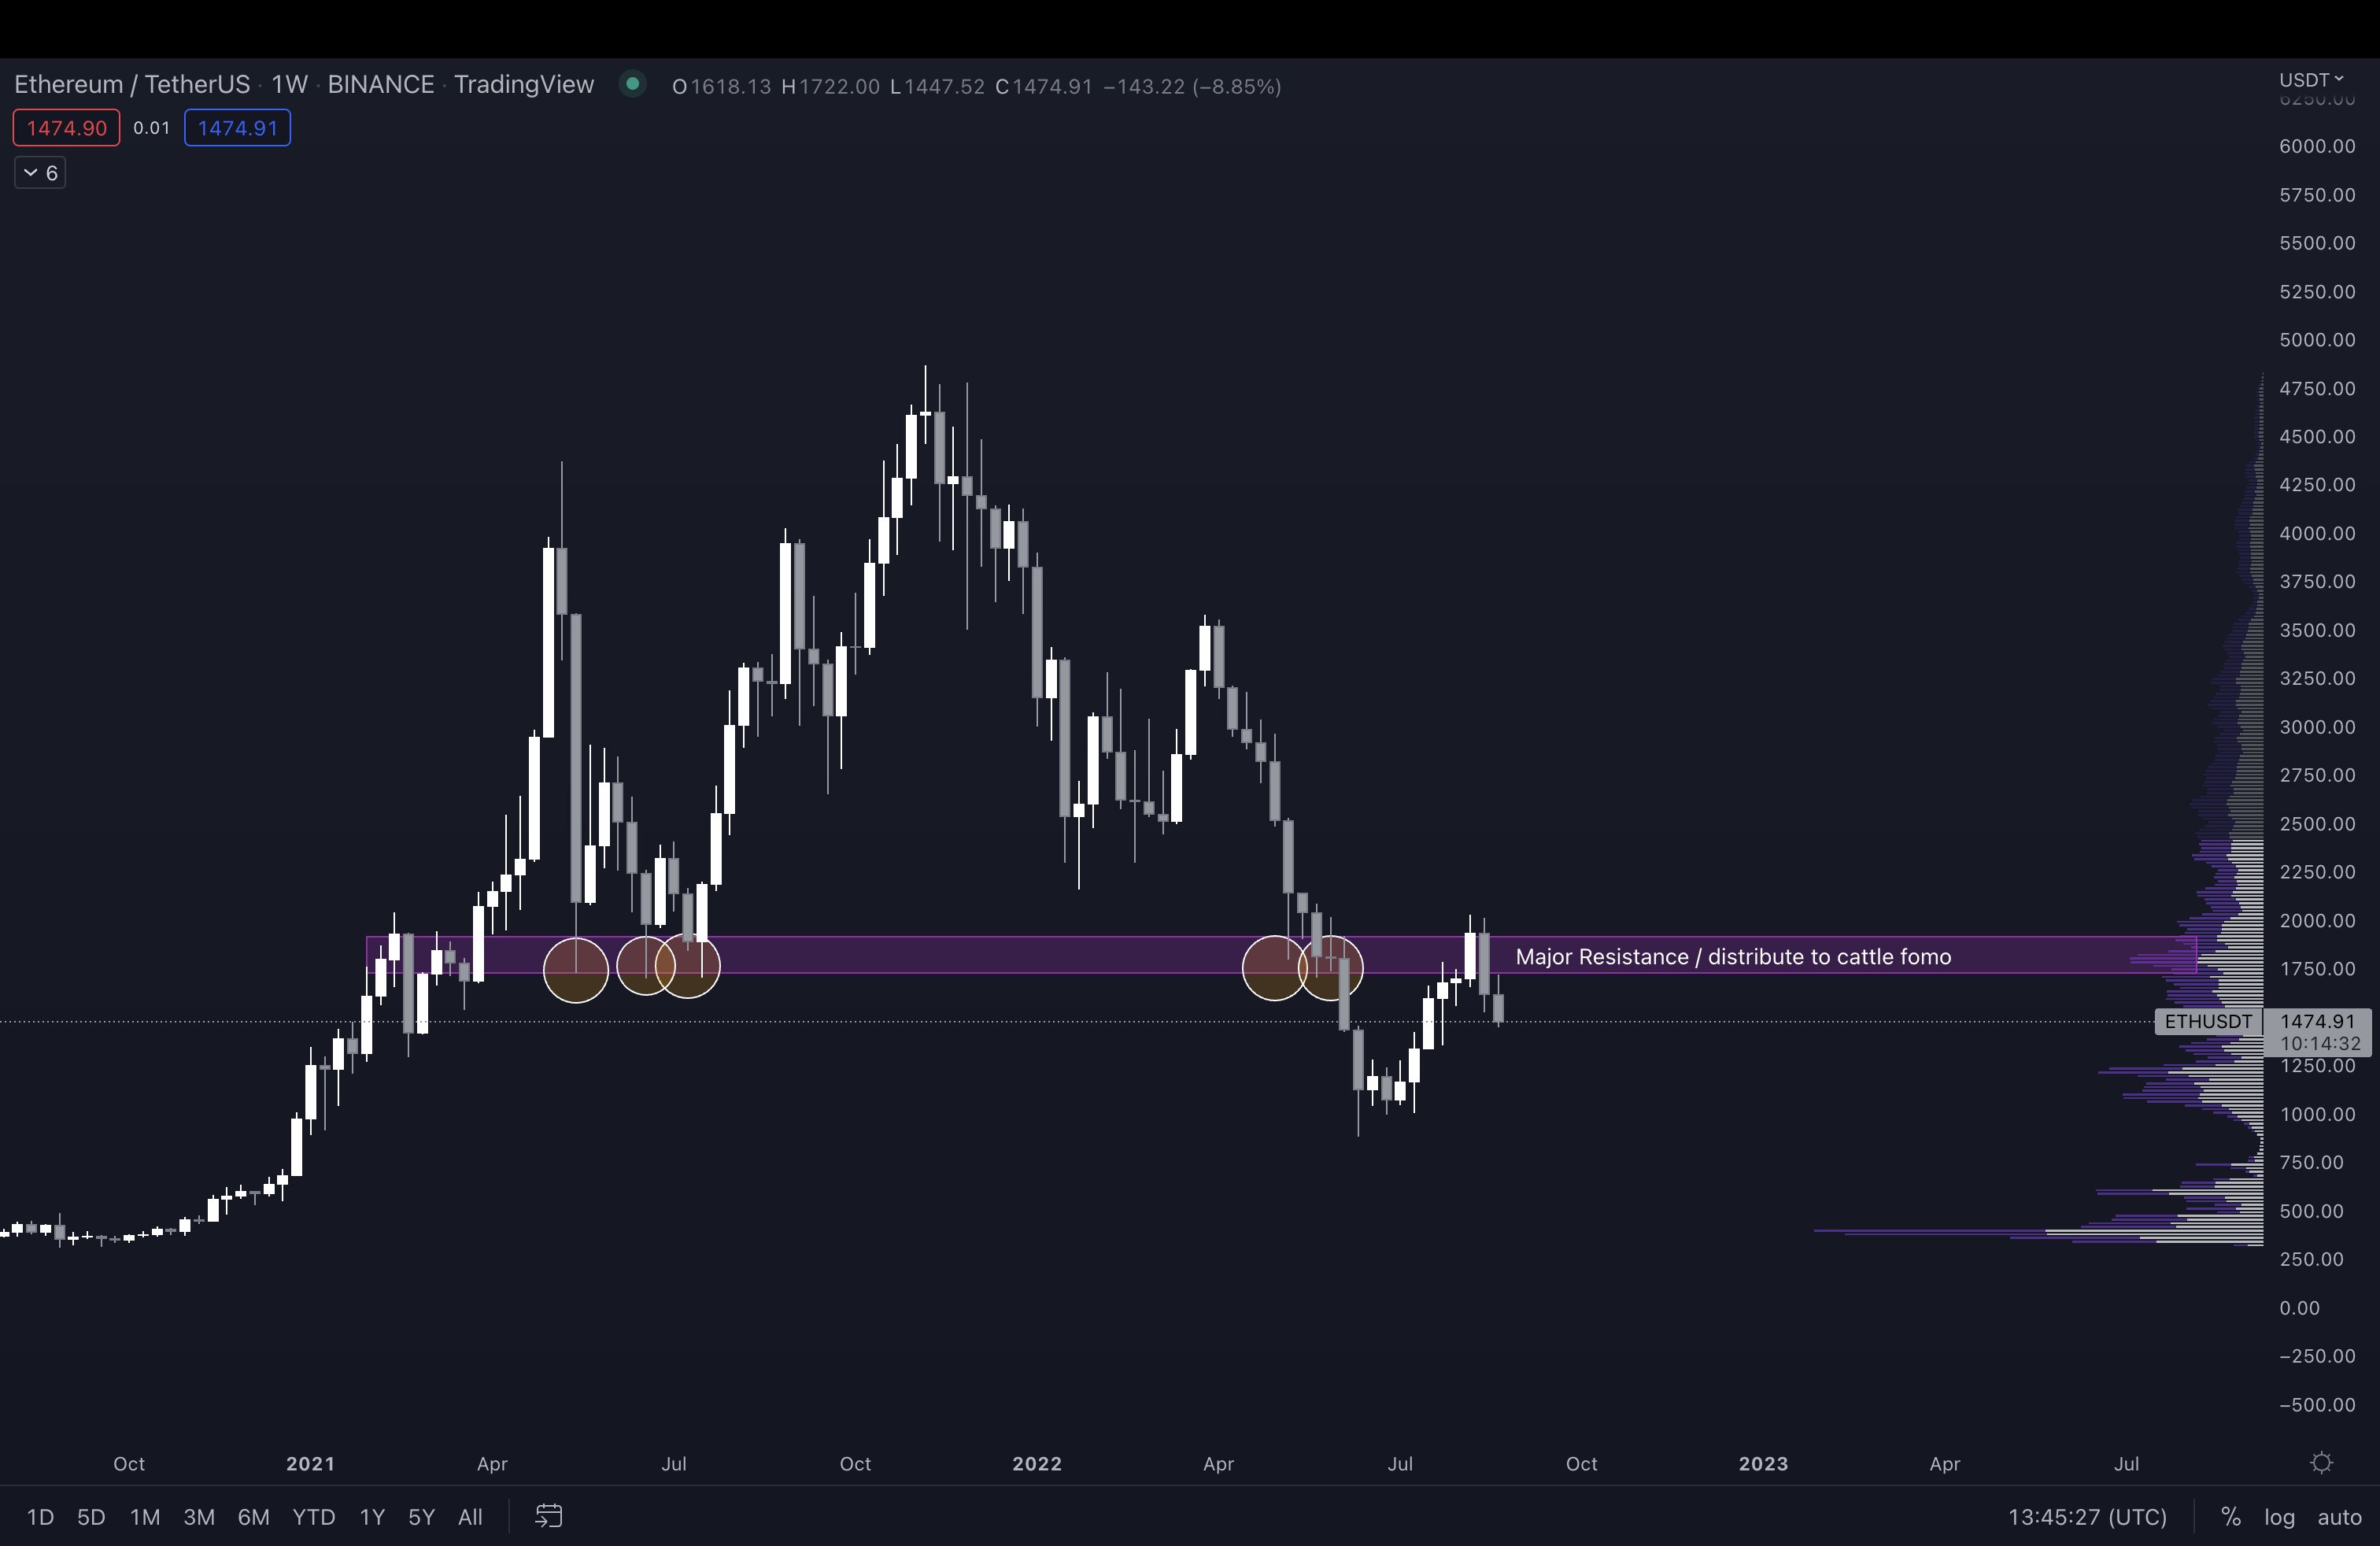
ETH-USDT price chart
Ethereum Triple Halving author sees red flag in ETH price trend
In contrast to Ethereum price predictions by Pentoshi and the negative funding rate setup, the author of Ethereum Triple Halving narrative is bearish on ETH. @squishchaos on Twitter, Nikhil Shamapant is bearish on Ethereum as the altcoin is hit by a downtrend, and its correlation to equity risk preference remains high.
The ideal $ETH set up is
— Squish (@SquishChaos) August 28, 2022
1. $ETH uptrending
2. ETH correlation to equity risk preference high*
3. Equity Risk preference uptrend
That was Q1 2020.
Worst set up
1. ETH downtrending
2. ETH correlation to equity risk preference high
3. Equity risk preference downtrend
That's today.
Author

Ekta Mourya
FXStreet
Ekta Mourya has extensive experience in fundamental and on-chain analysis, particularly focused on impact of macroeconomics and central bank policies on cryptocurrencies.



