Ethereum staking explodes ahead of the Merge, 13.3 million ETH on the deposit contract
- Ethereum staking rate exceeded 11% ahead of the transition to proof-of-stake, according to OKLink.
- 36,000 ETH have been added every week to the staking contract since the beginning of August.
- Ethereum price could decline to $1,300 before bouncing higher, argue analysts.

The Ethereum Merge, scheduled for mid-September, is drawing closer, as the volume of ETH deposited in the contract explodes. ETH2 staking addresses have climbed, as 13.3 million Ethereum tokens have been staked so far.
Also read: Ethereum bears initiate takeover as Merge shadow fork encounters issues
Can a peak in Ethereum staking help ETH price recover?
Ethereum price suffered a decline, yielding 20% losses over the past week. Based on data from OKLink, there is a consistent increase in the volume of Ethereum staked on the ETH2 contract. 13,344,312 ETH tokens have been staked on the ETH2 staking contract, equivalent to $20.7 billion.
Despite the uncertainty surrounding Ethereum’s transition to proof-of-stake and the likelihood of a hard fork driven by proof-of-work proponents, the community has supported the Merge through ETH staking. It remains to be seen whether an increase in the volume of ETH staked fuels a bullish sentiment among holders.
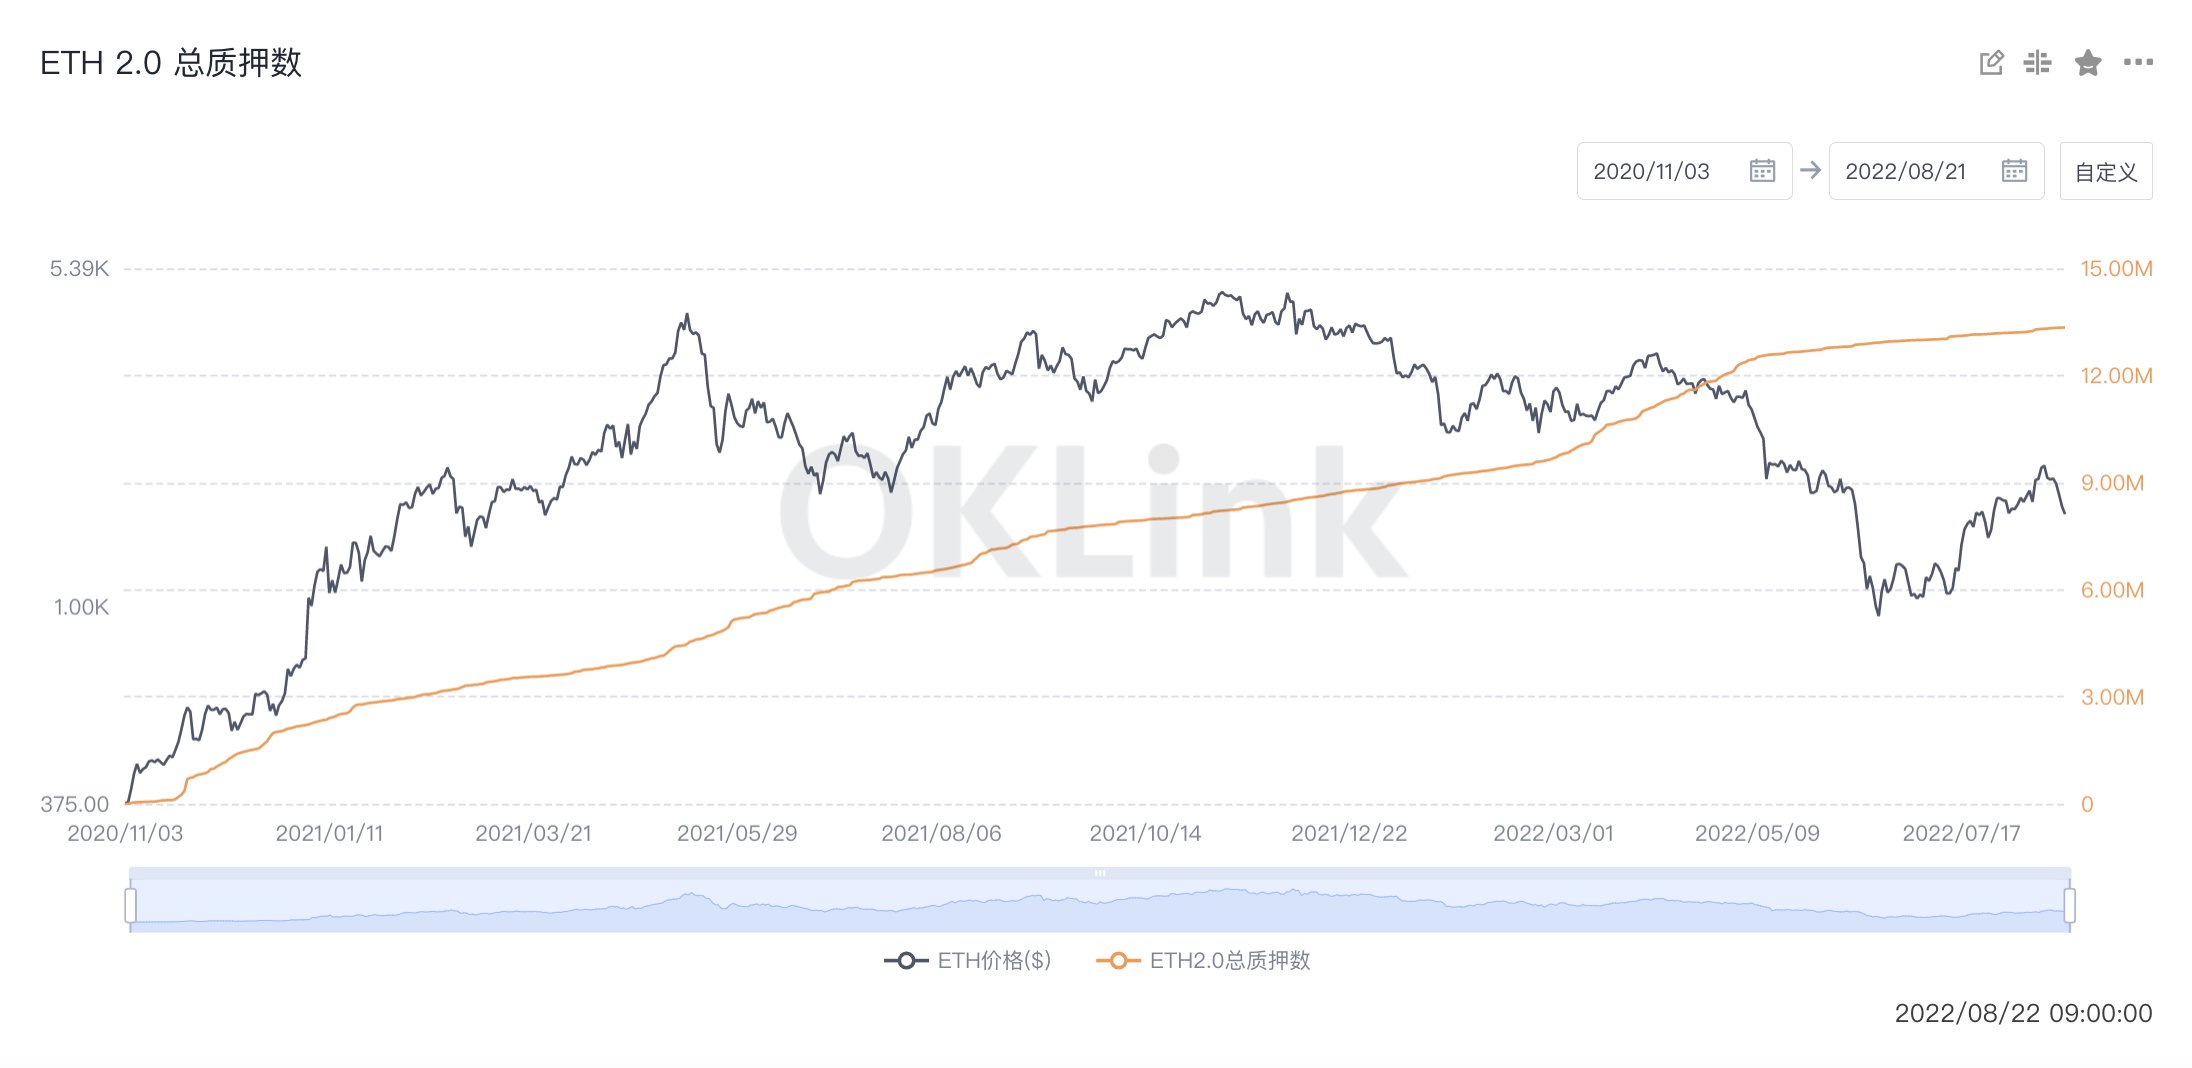
ETH2 staking
Every week since the beginning of August, 36,000 ETH have been deposited in the contract. This shows crypto trader’s support for the altcoin ahead of the Merge, an event slated to change the course of Ethereum’s value, utility and adoption.
Ethereum price could decline before recovery
Analysts have evaluated the Ethereum price chart and revealed a likelihood of decline to $1,300. Smart Contracter, a leading crypto analyst and trader, predicts that ETH could hit a higher low before its recovery. The analysts considers $1,300 the ideal price level to accumulate the altcoin.
Smart Contracter applied Elliott Wave Theory to the Ethereum price chart and noted that the larger ABC pattern correcting the five wave rise has begun on Ethereum. The analyst therefore expects a bounce that ends up being a higher low for Ethereum.
If Ethereum price structure continues to look bullish at $1,300, that is the correct level to scoop up ETH before the final wave, and a recovery rally.
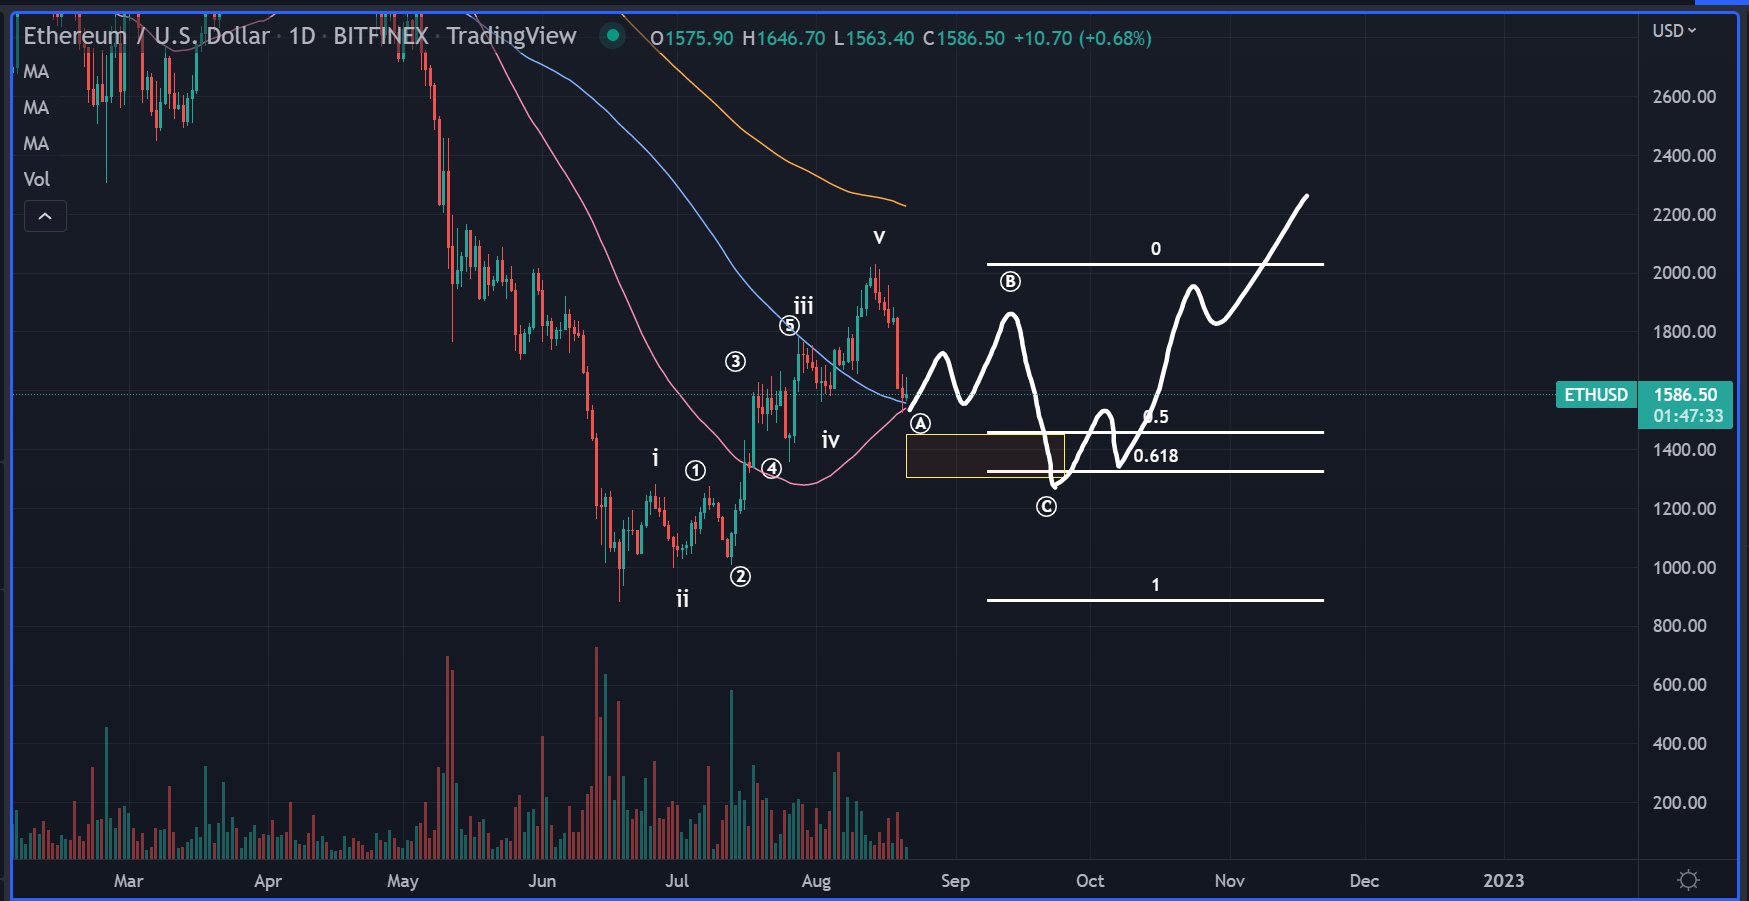
ETH-USD 1-day price chart
Author

Ekta Mourya
FXStreet
Ekta Mourya has extensive experience in fundamental and on-chain analysis, particularly focused on impact of macroeconomics and central bank policies on cryptocurrencies.



