Ethereum Classic Price Prediction: ETC prepares for a 120% rally
- Ethereum Classic price attempting to emerge above the declining trend line for May.
- 2018 high at $46.98 remains the critical line in the sand for any weakness in ETC.
- 38.2% Fibonacci retracement level at $85.36 standing in front of the breakout attempt.

Ethereum Classic price closed last week down 45%, but it has followed it with a 44% rebound this week, lifting the digital asset to May's declining trend line. The rebound has not registered an extreme overbought reading on any necessary timeframe, suggesting the current ETC pause is not the beginning of a new leg lower but a slow release of price compression.
Ethereum Classic price calm in a period of indecision and uncertainty
Ethereum Classic price made a statement on May 24, closing up 42.33%, the largest daily gain since May 2017. The sizeable recovery put bears on alert and established the foundation for ETC to tackle May’s declining trend line moving forward.
The ETC developments from the beginning of May until May 23 were an extraordinary reversal of fortune for investors. On May 19, Ethereum Classic price fell 55% on an intra-day basis and a stunning 75% from the May 6 high of $158.76. The crash followed a 1200% advance over six weeks after breaking out from a symmetrical triangle at the beginning of April.
A positive result of the crash was removing the overbought readings on the daily and weekly Relative Strength Indexes (RSI). It has positioned Ethereum Classic price to overcome resistance and revive the larger rally into new highs.
Ethereum Classic price may experience some weakness in the short-term, potentially taking ETC down to the 50-day simple moving average (SMA), but it should be short-lived.
If there is a renewal in buying interest, Ethereum Classic price will meet resistance at the 50% retracement level of the May decline at $99.38, quickly followed by the psychologically important $100.00. The next round of support is the 61.8% retracement at $113.39.
Bolder ETC projections point to the 361.8% extension of the 2018-2019 correction at $161.33, just slightly above the all-time high at $158.76 and yielding a 120% gain from price at the time of writing.
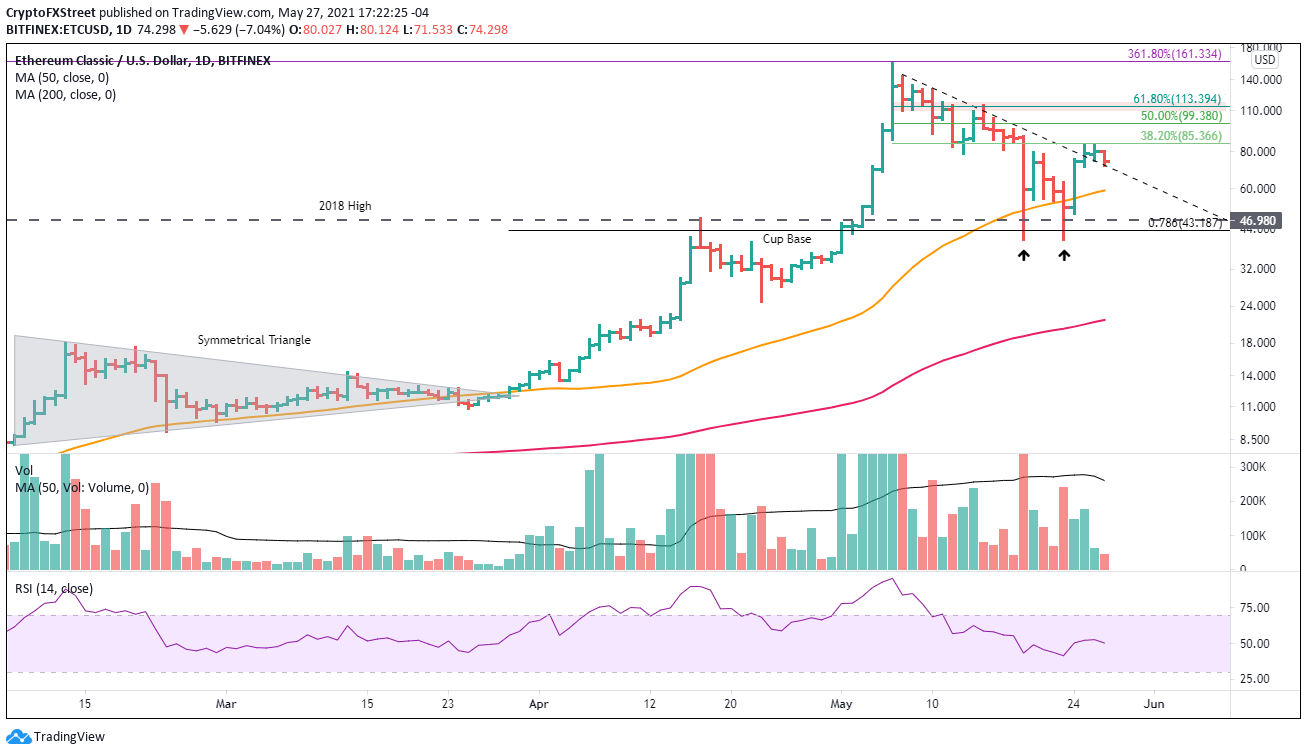
ETC/USD daily chart
If Ethereum Classic price pullback slides below the 50-day SMA at $59.19, the 2018 high at $46.98 should be credible support, followed by the 78.6% retracement of the rally from the beginning of April at $43.19.
The price action of Ethereum will sway ETC, but once the smart contracts token confirms a new leg higher (as projected), Ethereum Classic price will follow with compelling returns.
Author

Sheldon McIntyre, CMT
Independent Analyst
Sheldon has 24 years of investment experience holding various positions in companies based in the United States and Chile. His core competencies include BRIC and G-10 equity markets, swing and position trading and technical analysis.




