Ethereum Classic Price Forecast: ETC poised for a 40% rally after historic crash
- Ethereum Classic price closed yesterday with the largest daily gain since May 24, 2017.
- ETC tested the 2018 high at $46.98 for the second time in May.
- May’s declining trend line keeping price strength contained today.

Ethereum Classic price made a statement yesterday, closing up 42.33%, the largest daily gain since May 2017. The sizeable recovery put bears on alert and established the foundation for ETC to tackle May’s declining trend line moving forward.
Ethereum Classic price looks to regain FOMO
The developments since early May for Ethereum Classic are an extraordinary reversal of fortune for investors. On May 19, Ethereum Classic price fell 55% on an intra-day basis and a stunning 75% from the May 6 high of $158.76. The crash followed a 1200% advance over six weeks from the breakout from a symmetrical triangle at the beginning of April.
On Sunday, May 23, Ethereum Classic price dropped near the May 19 low of $40.00, but it rebounded to close back above the 2018 high at $46.98 for the second time in five days. It put an exclamation point on the importance of the 2018 high and left ETC in a position to rally higher. Nevertheless, the digital token did close the week with the largest weekly loss since 2016 at 44.84%.
Yesterday, Ethereum price followed up the rebound from below the 2018 high with a 42.33% gain, thereby overcoming the magnet effect of the 50-day simple moving average (SMA) that been present the previous two days and setting up ETC for a new test of May’s declining trend line, currently at $81.17.
Adding to a better outlook is the removal of extreme overbought conditions on the daily and weekly Relative Strength Indexes (RSI). It frees Ethereum price for a substantive rally before returning to an overbought condition.
On the 12-hour chart, May’s declining trend line closely intersects with the 50 twelve-four SMA at $84.89, creating a notable resistance level for the current rebound.
A 12-hour close above $84.89 will be the first opportunity to initiate a pilot buy in ETC. If Ethereum price does close above $84.89, the digital token will be free to test the resistance defined by multiple candlesticks in the first half of May between $110.00 and $117.00, and the 61.8% Fibonacci retracement of the May crash at $113.39. It would represent a 40-50% gain from price at the time of writing.
No further obstacles are noted until the all-time high at $158.76 and the 361.8% extension of the 2018 correction at $161.33.
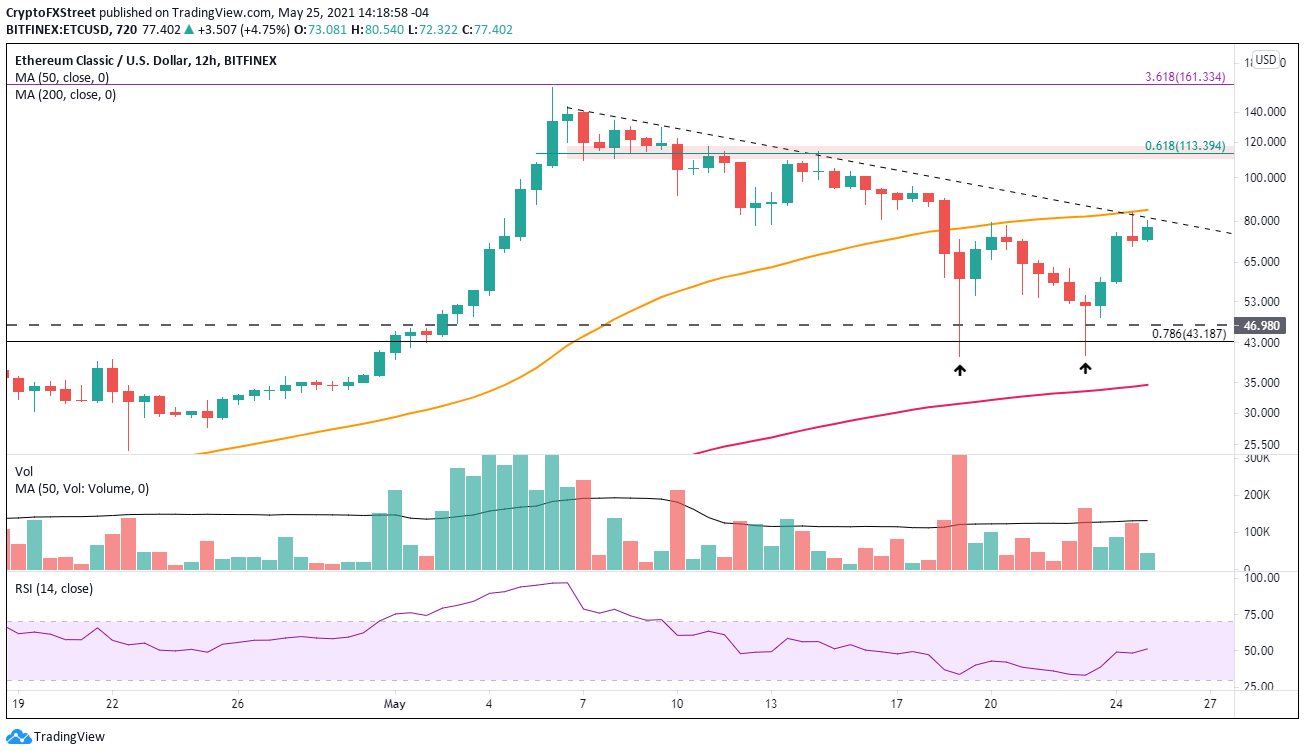
ETC/USD 12-hour chart
Ethereum Classic price does encounter a significant technical barrier to achieving a rally into the $110.00-$117.00 range, reinforced by a tenuous situation in the cryptocurrency market. At present, there is no credible support until the 2018 high at $46.98, leaving ETC vulnerable to intra-day volatility.
A daily close below $46.98 would need to occur before entertaining a deeper correction for ETC.
Author

Sheldon McIntyre, CMT
Independent Analyst
Sheldon has 24 years of investment experience holding various positions in companies based in the United States and Chile. His core competencies include BRIC and G-10 equity markets, swing and position trading and technical analysis.