Ethereum Classic Price Analysis: ETC stuck between two key averages, downside favored
- ETC price remains trapped between two key averages on the 12H chart.
- Bearish crossover, as well as RSI, remain in favor of the ETC bears.
- Acceptance above 80.00 could negate the near-term bearish tone.

Following Wednesday’s collapse to three-week lows of $40.71, Ethereum Classic’s recovery lacks follow-through, as the price remains in a phase of bearish consolidation for the fourth straight day this Sunday.
ETC/USD rallied to all-time highs of $164.72 earlier this month, catching up with the broad crypto market advance, as the top 10 widely traded digital assets witnessed parabolic rise before the latest brutal market crash.
The ETC price is attempting a tepid bounce, having turned green for the first time in three days, at the time of writing.
Ethereum Classic Price defends key support but for how long?
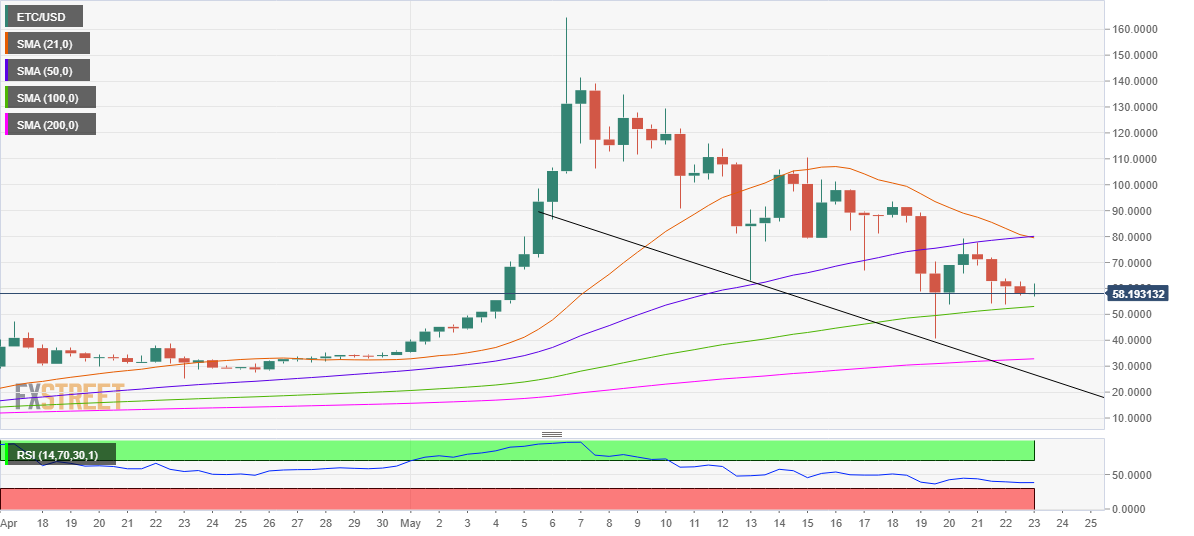
As observed on Ethereum Classic’s 12-hour chart, the price is moving back and forth in a narrow range around the $60 mark so far this Sunday.
The ETC price has managed to defend the upward-sloping 100-simple moving average (SMA) at $53.05 following a recovery from the flash crash.
Meanwhile, the bullish attempts continue to find sellers below the confluence of the 21 and 50-SMAs at $80.0. A breakout in either direction is needed to determine the next course for the ETC traders.
However, with the bear cross spotted on the given time frame and the Relative Strength Index (RSI) still ranging in the bearish region, the downside appears more compelling for Ethereum Classic.
On Saturday, the 21-SMA cut the 50-SMA from above, charting a bearish crossover, which signals a potential move lower.
Therefore, the ETC bears need a 12-hourly candlestick close below the 100-SMA, in order to confirm a downside break, opening floors for a test of the swing lows of $40.71.
The next powerful cushion for the bulls is seen at the 200-SMA at $32.85. The three-week-old descending trendline support at $25.75 could likely be the line in the sand for the optimists.
ETC/USD: 12-hour chart
On the flip side, the ETC price must scale the abovementioned strong resistance at $80.0 on a sustained basis.
The recovery momentum could then gain traction towards the weekly highs of $93.64.
The psychological $100 mark is expected to challenge the bullish commitments going forward.
ETC/USD: Additional levels to watch
Author

Dhwani Mehta
FXStreet
Residing in Mumbai (India), Dhwani is a Senior Analyst and Manager of the Asian session at FXStreet. She has over 10 years of experience in analyzing and covering the global financial markets, with specialization in Forex and commodities markets.


