Ethereum Classic buyers are not fading without a fight, targeting 20% gains
- Ethereum Classic is looking for support around R1 monthly resistance.
- Buyers are trying to break the descending trend line from August 15.
- A retest of $78 would mean 20% upside potential.

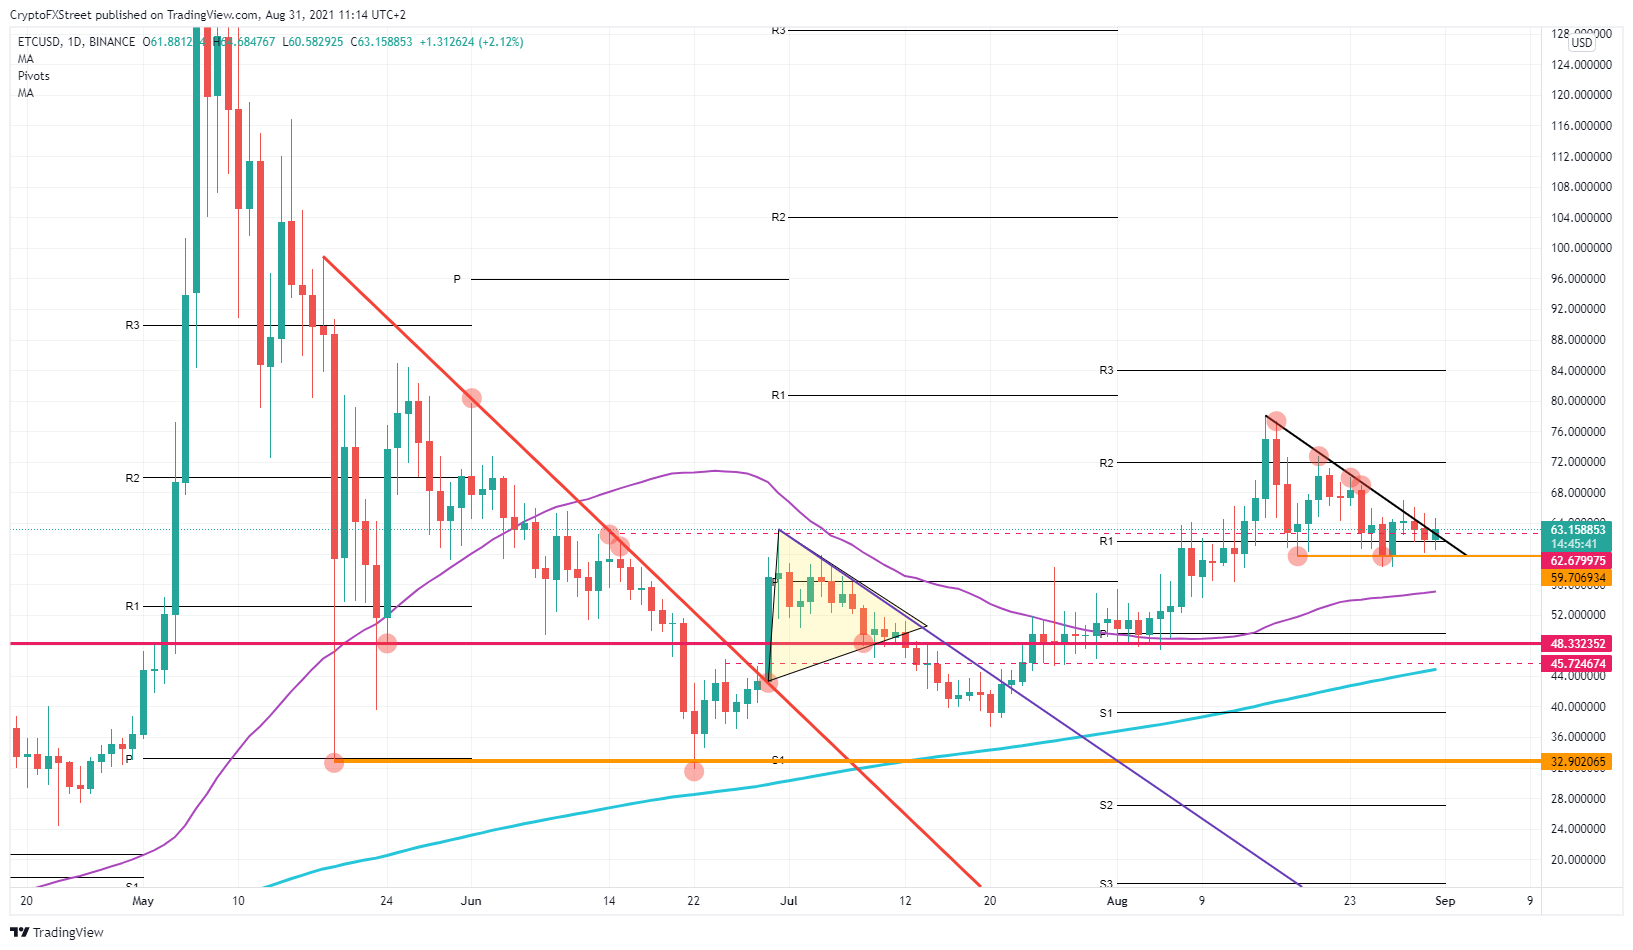
Ethereum Classic (ETC) has been wrong-footed since August 15 and has been descending since then, but buyers do not seem convinced that they need to let short sellers take control. Sellers are trying to squeeze out the buyers at $60, but buyers are reluctant to forfeit their longs. This caused a break of that descending trend line on August 28. That trend line is being chopped up now by both buyers and sellers.
Buyers can easily protect price action in ETC and can lock in 20% gains within days
The double bottom works very well as a tandem as buyers fade into ETC price between $59 and $61.50. The lowest level at $59 is short-term support originating from August 18 but shows that it is holding price action just fine. The proof is the descending candle on August 26 paired in full with the green candle on August 27.
Although sellers are trying to squeeze price action back down to that level, the monthly R1 resistance level is again reclaiming support as the bodies of the candles could not dip or even stay below $61.50. Buyers will have stepped in and are still stepping in each time price actions falls to these regions. Hence, a break-out is imminent, and it looks to go in favor of the buyers.
ETC/USD daily chart
Expect some choppiness in the price action, but a breakout is expected this week. The best signal to have that buyers are in control would be to see a pop higher, followed by a test of the descending trend line and a bounce off there. That would be the best sign that buyers are in a good solid trade, and a 20% upside would bring us to a retest of the level on August 15.
Should sellers be able to push the price below, expect their run lower to be halted quite quickly by the 55-daily Simple Moving Average (SMA) at $55 and the monthly Pivot level at $49.60.
Author

Filip Lagaart
FXStreet
Filip Lagaart is a former sales/trader with over 15 years of financial markets expertise under its belt.




