Ethereum Classic price indecisive as ETC remains trapped between two key averages
- ETC price remains trapped between two key averages on the 12H chart.
- Multiple resistance levels cap the upside amid neutral RSI.
- Bullish 50-SMA is the level to beat for the ETC buyers.

Ethereum Classic is fluctuating between gains and losses, lacking a clear directional for the second consecutive day this Sunday.
ETC/USD has entered a phase of consolidation following Friday’s impressive rebound from two-week troughs at $58.69. Saturday’s Doji candlestick seems to have watered down expectations of a continued recovery in ETC price.
However, a fresh bid wave seen across the crypto board over the last hours could help limit Ethereum’s downside.
Ethereum Classic price at coin flip levels
As observed on Ethereum Classic’s 12-hour chart, the price is wavering in a tight range around the $64 mark, at the time of writing.
The upward-sloping 50-simple moving average (SMA) at $62.87 is guarding the downside over the past 36 hours while the ETC bulls continue to face stiff resistance at the falling trendline resistance at $65.81.
A range breakout is waited for a sustained move in either direction. However, with the Relative Strength Index (RSI) flatlined at 50.00, investors are lacking a clear sense of direction.
That said, ETC price faces two healthy resistance levels in the horizontal 21-DMA at $65.20 and the abovementioned descending trendline.
Therefore, the path of least resistance appears to the downside for ETC traders.
Acceptance above the trendline hurdle could pave the way towards the $70 mark.
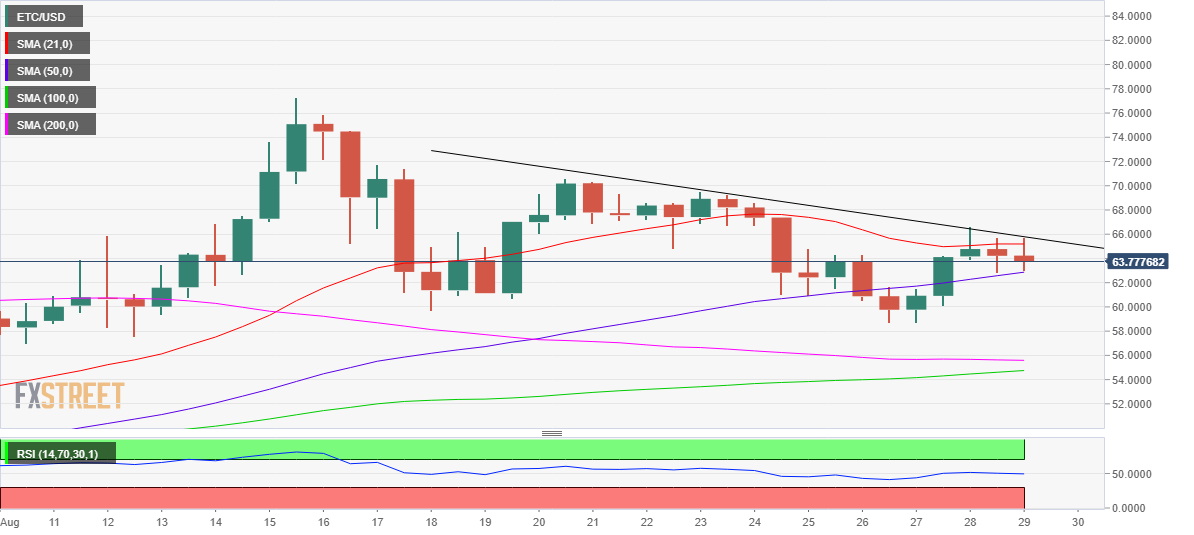
ETC/USD: 12-hour chart
On the flip side, a 12-hourly candlestick closing below the ETC price could accentuate the bearish pressures, calling for a test of the two-week lows.
The 200-DMA at $55.59 will challenge the bullish commitments should the sellers take over complete control.
Author

Dhwani Mehta
FXStreet
Residing in Mumbai (India), Dhwani is a Senior Analyst and Manager of the Asian session at FXStreet. She has over 10 years of experience in analyzing and covering the global financial markets, with specialization in Forex and commodities markets.




