Ethereum Classic price hesitates, but ETC on pace for the best August since 2016
- Ethereum Classic price closing in on the fourth consecutive positive week for the first time since April 2020 (also a bottom).
- ETC six-hour chart is flashing a bearish momentum divergence with the Relative Strength Index (RSI), not confirming price highs.
- The June 30 high of $62.45 proving to be a rally killer, keeping the digital token from testing the 38.2% Fibonacci retracement.

Ethereum Classic price closed July with an inside month that triggered on August 7 with a 13.77% gain. The price compression generated by the inside month should propel ETC to higher prices, but in the short term, the digital asset needs to sever the resistance invoked by the June 30 high of $62.45 on a daily closing basis.
Ethereum Classic price potential yet to be fully realized
Over the last 24 days, Ethereum Classic price shows a gain of 60.51% on a closing basis, a notable deviation from the 80%+ gain in Ethereum, but in line with most of the altcoins as of today. Moreover, ETC has logged a 23.71% return in August, making it the best August going back to 2016.
Over the last five days, Ethereum Classic price has been frustrated by the June 30 high of $62.45 on a daily closing basis and a slightly overbought reading on the daily chart. Nevertheless, as long as ETC remains above the descending parallel channel’s upper line, it will pursue higher prices over the long term, with the 38.2% retracement at $80.75 being the first obstacle after the June 30 high.
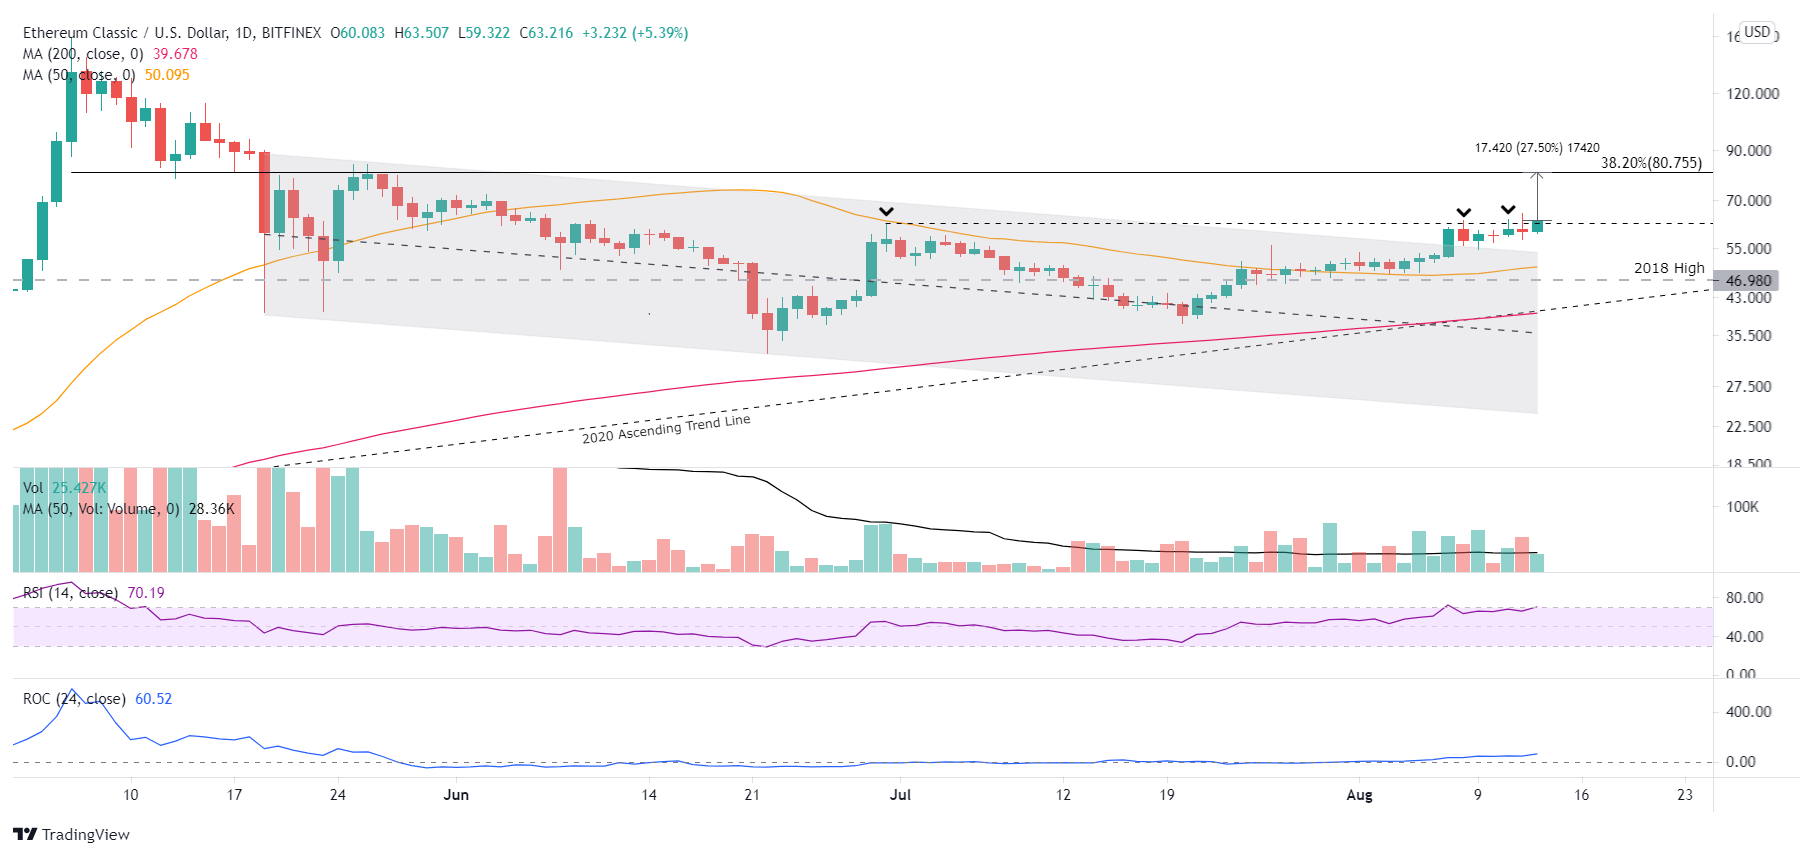
ETC/USD daily chart
With the June 30 high of $62.45 already challenging the bullish narrative, the RSI on the six-hour chart shows a bearish momentum divergence at yesterday’s Ethereum Classic price high. The combination of the resistance with the divergence may inspire a mild pullback in ETC, but the downside is well-protected by the 50-day simple moving average (SMA) at $50.09 and the 2018 high of $46.98. Thus, unless there is a daily close below $46.98, Ethereum Classic price will just be carving out a more complex price structure.
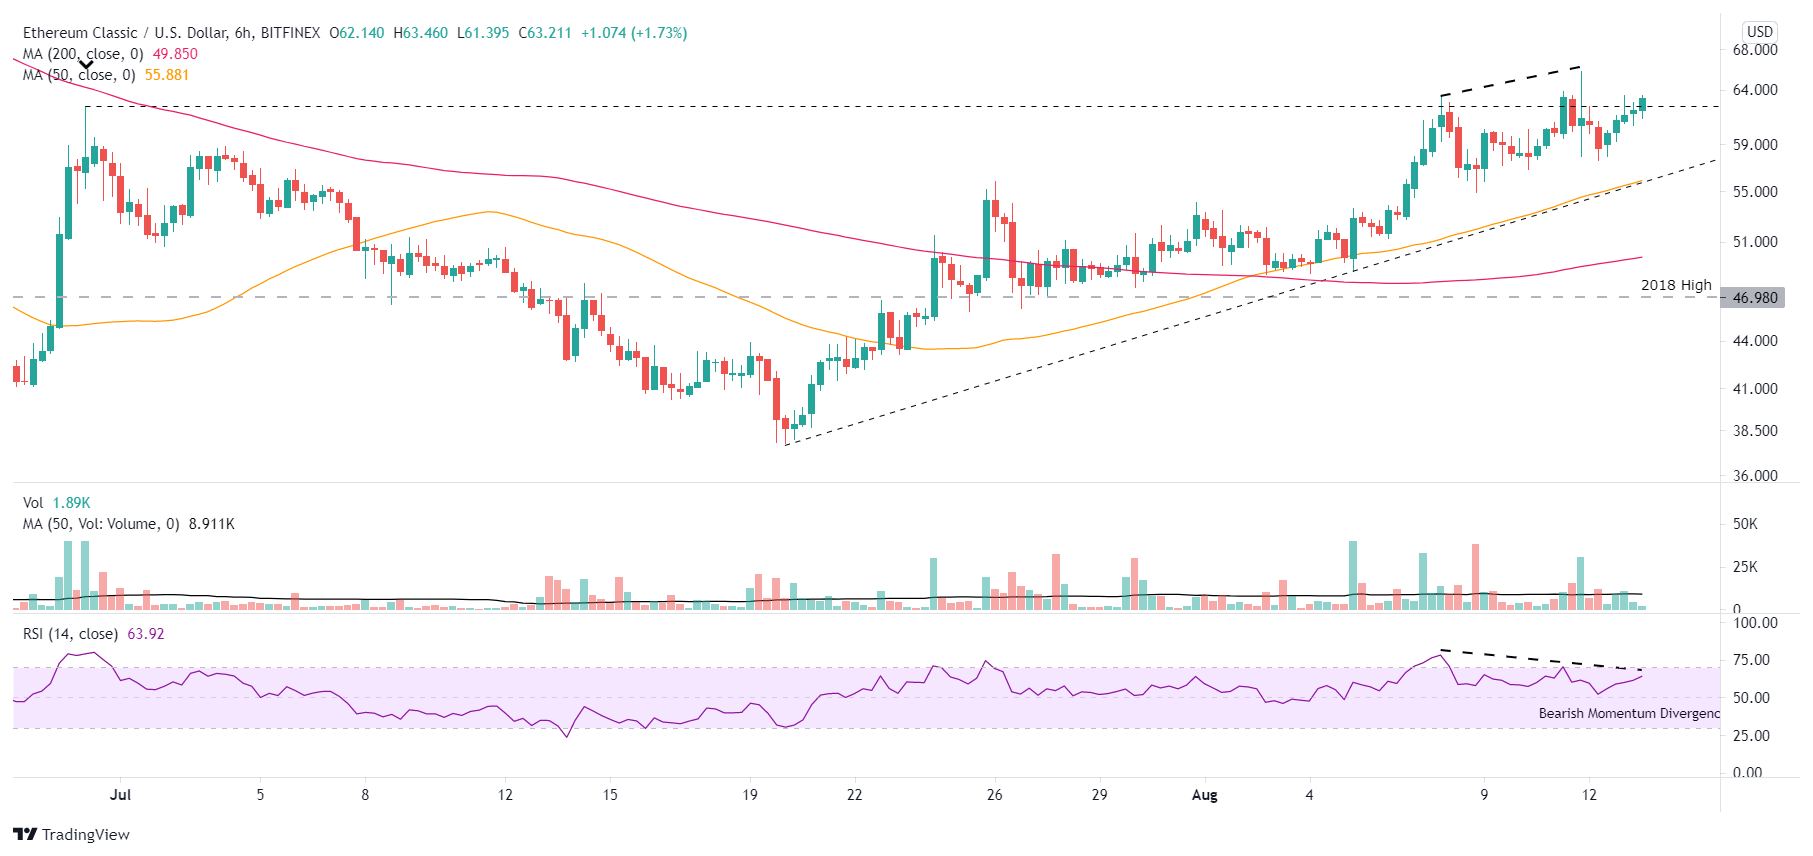
ETC/USD 6-hour chart
Ethereum Classic price began the rally on July 21 in a constructive position concerning its price structure. ETC was significantly above the 50-week and 200-day SMAs and was not cornered by the resistance attached to the May lows or subdued by a bearish Death Cross pattern on the daily chart. The result is a rally of over 60% at the current price.
Despite the current struggles with the June 30 high of $62.45, Ethereum Classic price remains in an advantageous position. It has the technical credentials to stimulate the ETC rally to the 38.2% retracement at $80.75, representing a 27% return from the current price. It is just a question of how long the consolidation at the June 30 high lasts and if the bearish momentum divergence on the six-hour chart converts to any weakness.
Here, FXStreet's analysts evaluate where ETC could be heading next as it looks primed to break out.
Author

Sheldon McIntyre, CMT
Independent Analyst
Sheldon has 24 years of investment experience holding various positions in companies based in the United States and Chile. His core competencies include BRIC and G-10 equity markets, swing and position trading and technical analysis.


