Ethereum, Chainlink, and Ren whales go into buying frenzy as these tokens suffer a steep correction
- The amount of ETH, LINK, and REN tokens held by non-exchange addresses has increased significantly over the past few weeks.
- Most altcoins suffered a significant pullback in the past 24 hours.

Today, the crypto market saw a notable pullback, dipping from a $398.6 billion market capitalization to a low of $386 billion in just three hours. Many altcoins have already bounced back up, with Bitcoin staying above $13,000.
Accumulation of Tokens Chart
 [22.33.16, 26 Oct, 2020]-637393461840085105.png)
This trend is not new and has been observed since May 27, 2020. REN had a massive jump from 379 million coins on non-exchange addresses on October 5 to 410 million only two days later. The uptrend continues for all three coins, indicating that declining prices are viewed as an excellent opportunity to buy-in.
Ethereum had to retrace to $390 before the final rally to $500
In our last article, we talked about Ethereum, stating that the digital asset was poised for a small retrace towards $390 before resuming the uptrend. The smart-contracts giant broke out of an ascending triangle on the daily chart on October 22.
ETH/USD daily chart
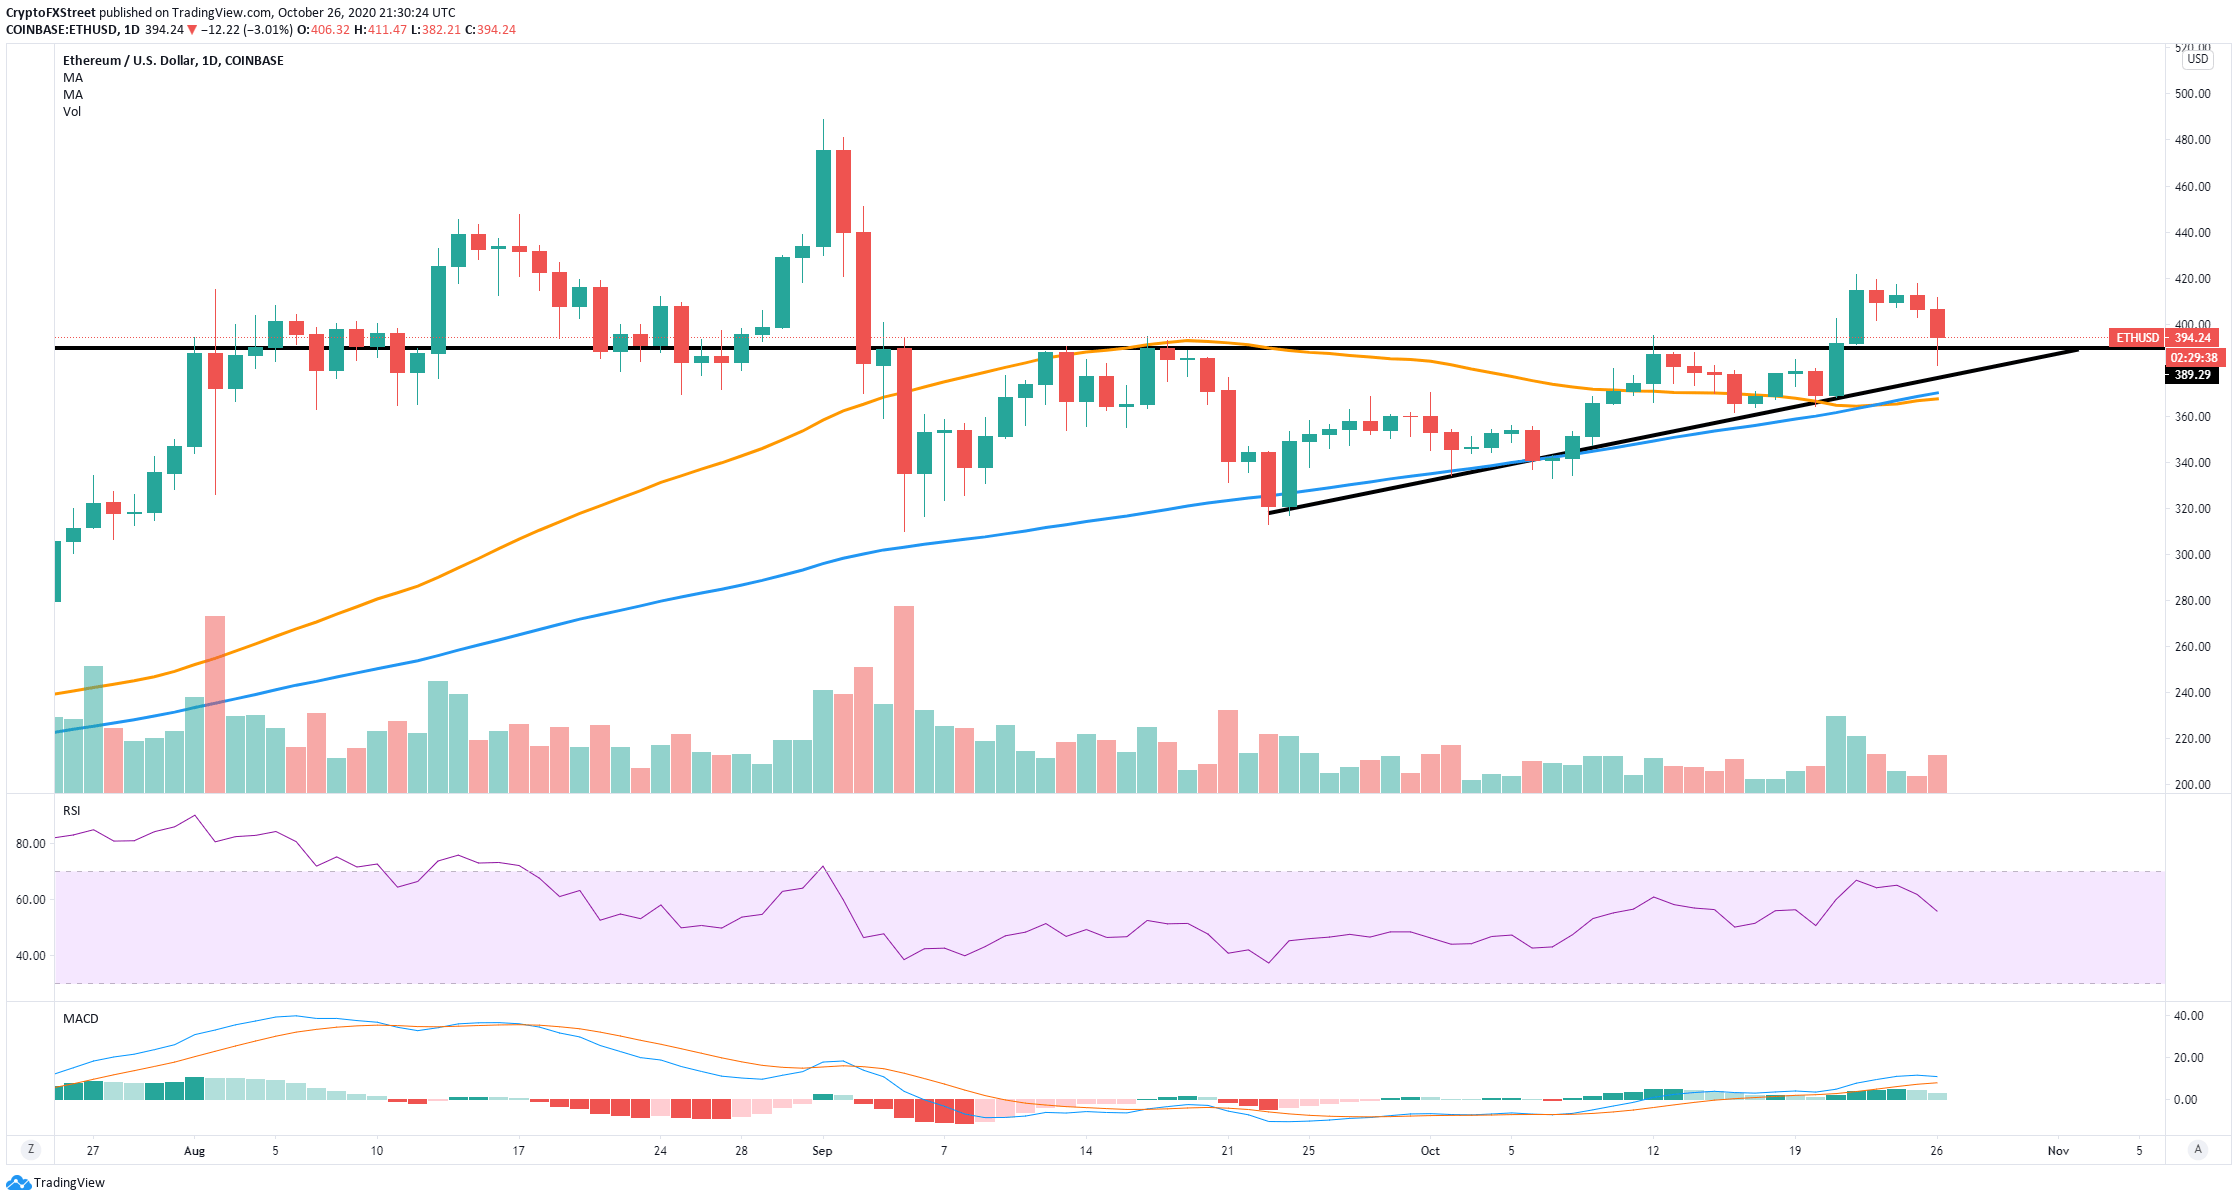
The price of Ethereum then slipped towards $390 to re-test the previous resistance as a support level. Although the price did pierce through it, it has managed to recover with ETH trading at $394 currently and still targeting $500 in the long-term.
Chainlink needs to break this crucial resistance level to target $18
LINK is currently trading at $11.82 after a slight rejection from the upper trendline of an ascending parallel channel formed on the daily chart. The 100-SMA is acting as a strong support level for now.
LINK/USD daily chart
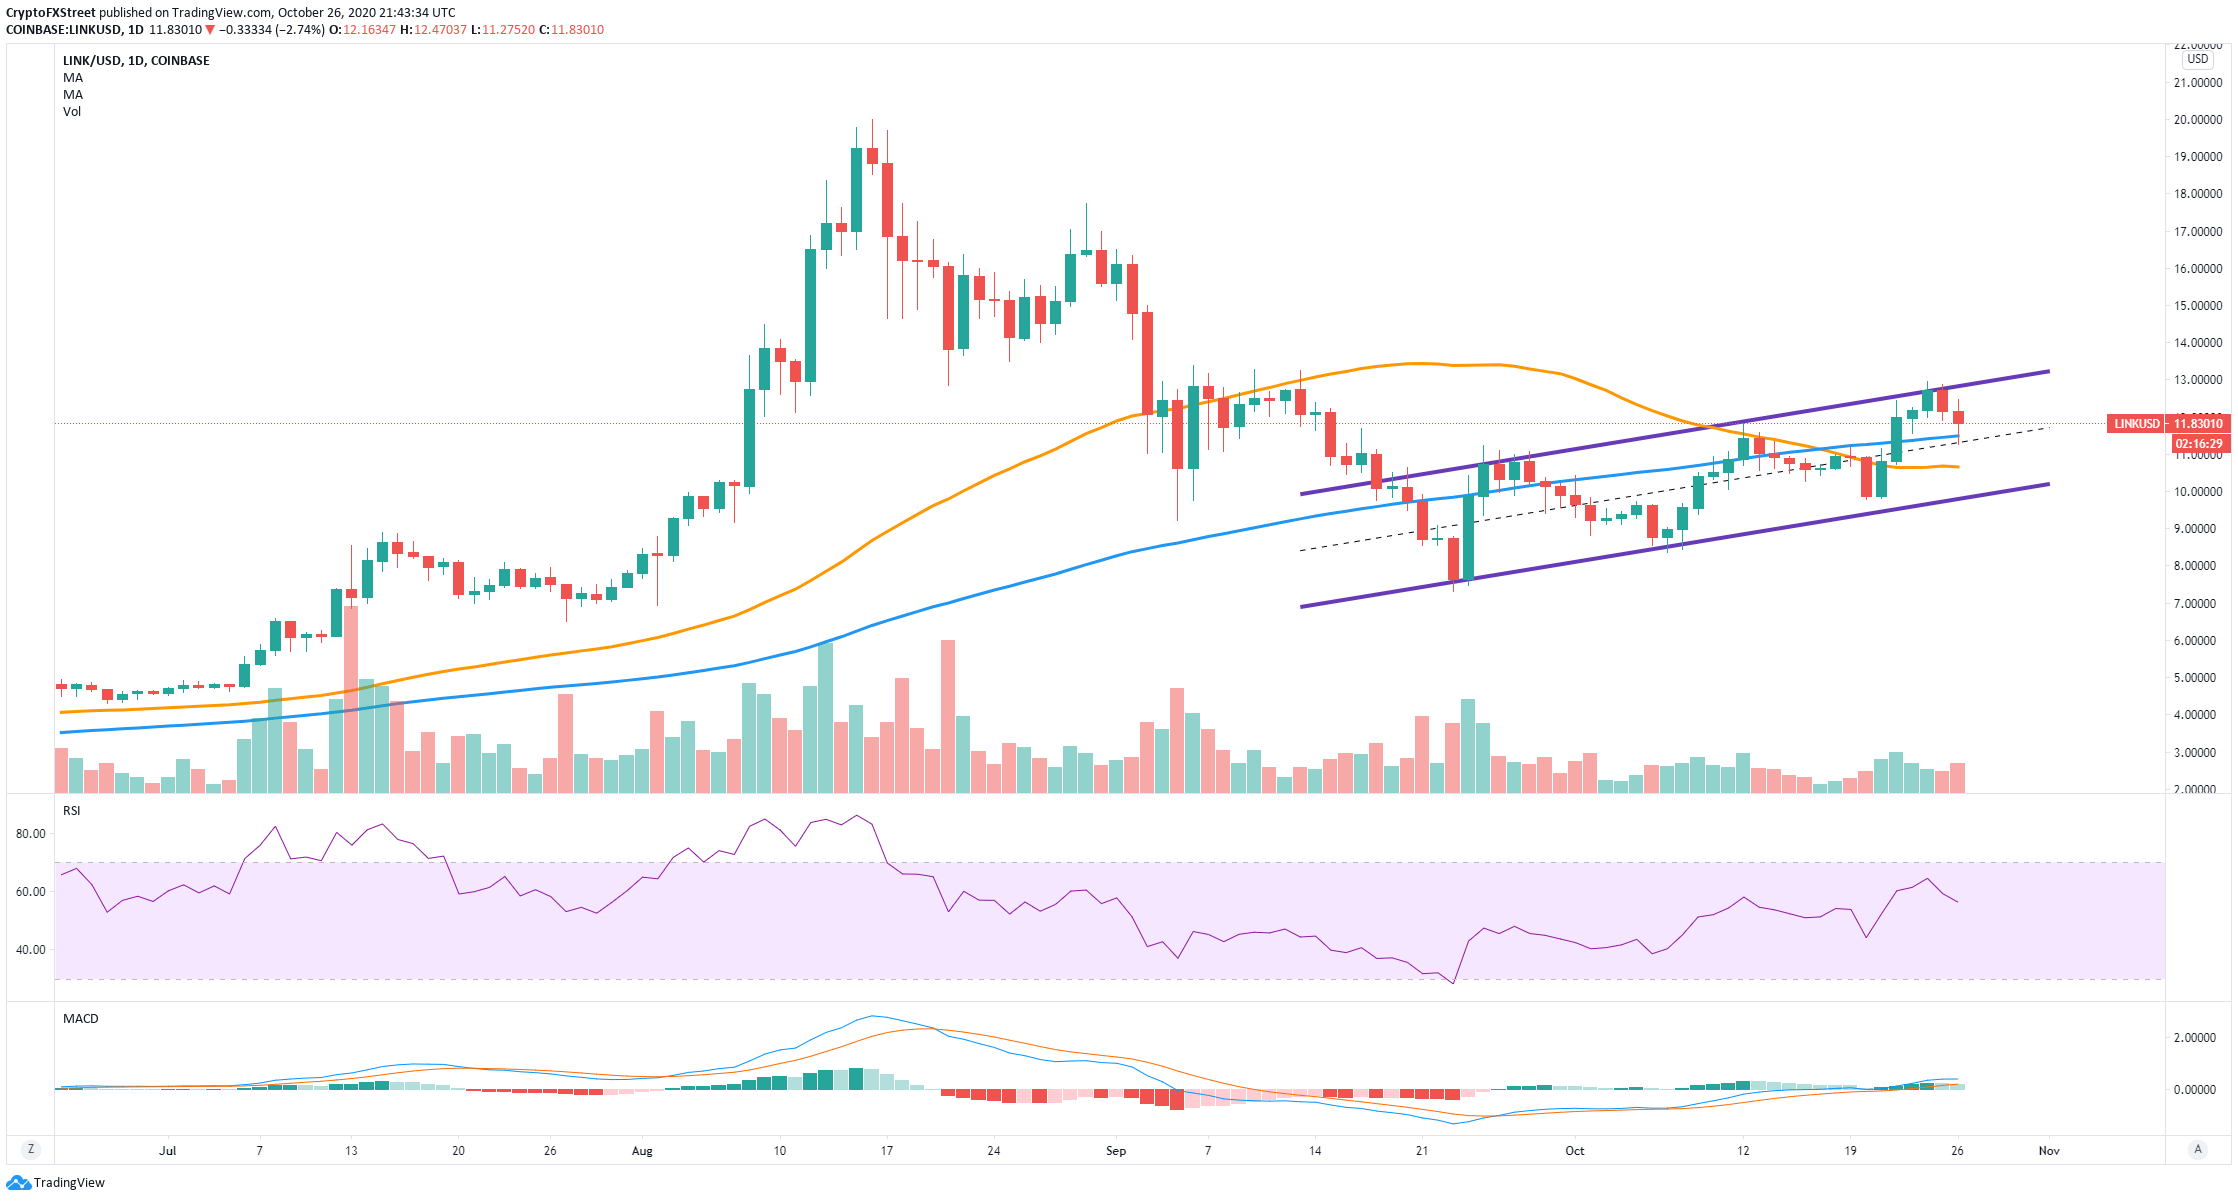
The MACD has remained bullish since September 26 and was gaining strength in the past two days. The most critical resistance level is established at $13, where the upper trendline is located. A breakout above this point can drive the price of LINK up to $18.
LINK's current rejection could push it to $10
On the other hand, the upper trendline of the ascending parallel channel has rejected LINK's price two times in a row on October 24 and 25. If the 50-SMA fails to hold, the price can easily slip towards the support level at $10.
LINK IOMAP Chart
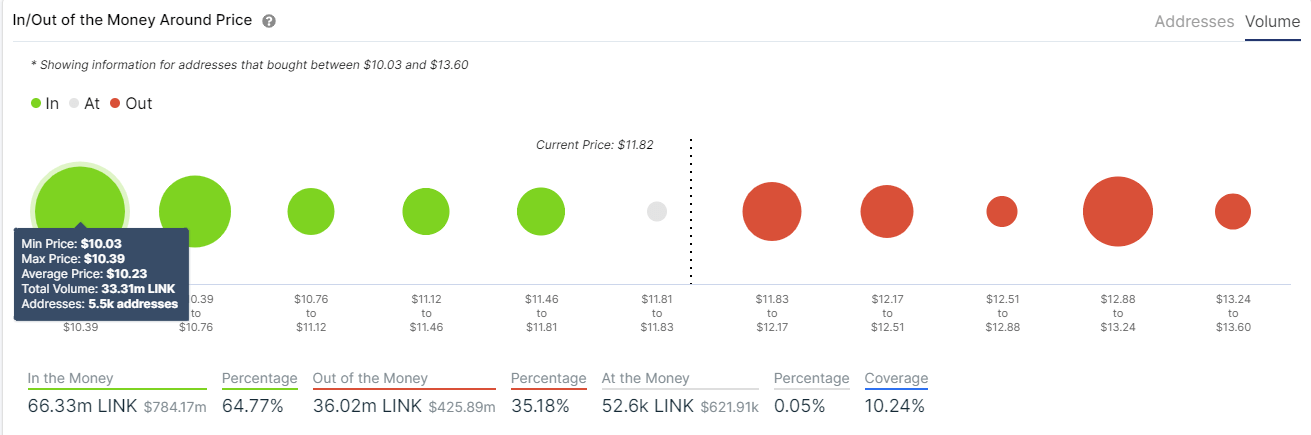
The In/Out of the Money Around Price seems to confirm this theory as it shows very little support to the downside until the area between $10.03 and $10.39, which has around 33.3 million LINK in volume.
REN bullish breakout seems weak
On the daily chart, the price of REN established an ascending triangle pattern. On October 11, the digital asset had a massive 38% breakout but got no continuation. One week later, the price fell towards $0.33 to re-test the resistance level as a support level.
REN/USD daily chart
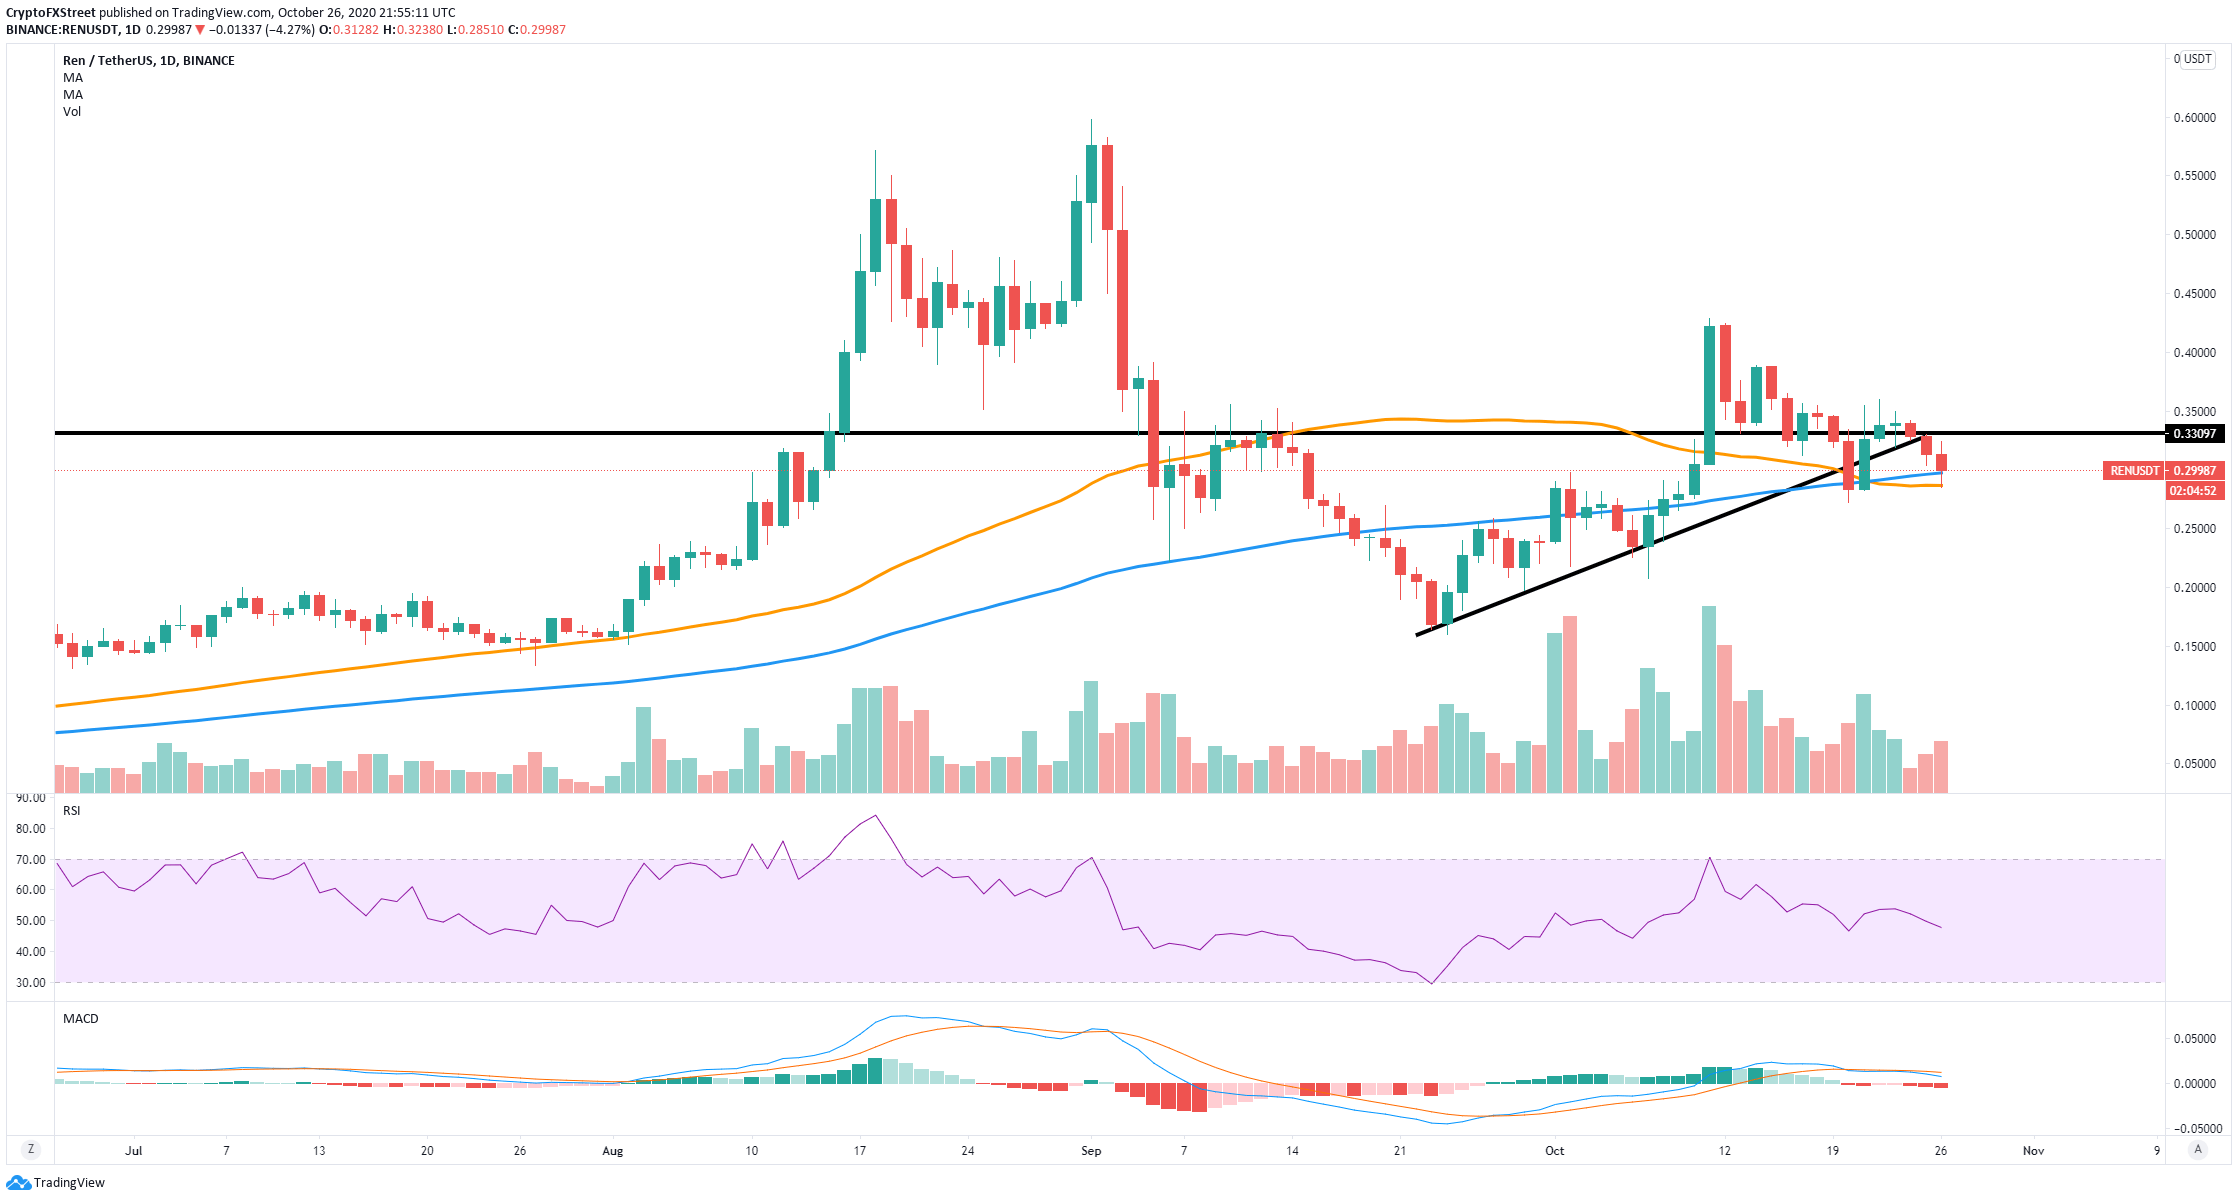
Unfortunately, the support level didn't hold, and REN's price slipped below it and the lower trendline of the ascending triangle but managed to defend the 50-SMA and the 100-SMA. A bearish breakout below both of these SMAs can drive the price of REN down to $0.17.
REN facing very little resistance to the upside
Nonetheless, considering the heavy buying pressure the digital asset is experiencing, and how there is very little resistance to the upside, REN can easily continue with its uptrend. It needs to break $0.33 in the short-term.
REN IOMAP Chart
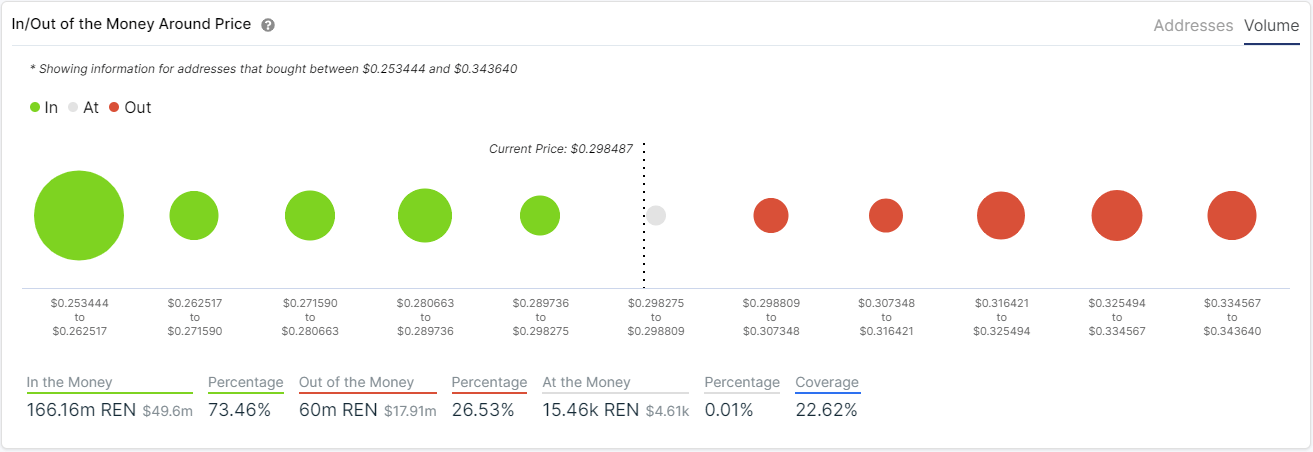
The In/Out of the Money Around Price chart shows no opposition well until $0.34, which is perhaps the most notable resistance area but still relatively weak compared to the support below. A breakout above $0.33 can drive REN towards $0.35.
Author

Lorenzo Stroe
Independent Analyst
Lorenzo is an experienced Technical Analyst and Content Writer who has been working in the cryptocurrency industry since 2012. He also has a passion for trading.


