Ethereum Price Prediction: ETH could retrace to $390 before the final rally to $500
- ETH is currently trading at $405 after a mild pullback from the $421 high.
- Several recent events are impacting the price of the digital asset significantly in different directions.

After a massive rally towards $421, Ethereum is finally under a consolidation period. One of the largest farming pools, Harvest Finance, was hacked around eight hours ago. Attackers were able to steal close to $24 million in cryptos, making the token's price fall by more than 60% within a few hours. Ethereum seems to have been mildly affected by the incident losing some bullish momentum.
Ethereum breaks out of an essential pattern on the daily chart
Ethereum managed to climb out of an ascending triangle formed on the daily chart. The breakout happened on October 22 and was followed by a notable spike in trading volume.
ETH/USD daily chart
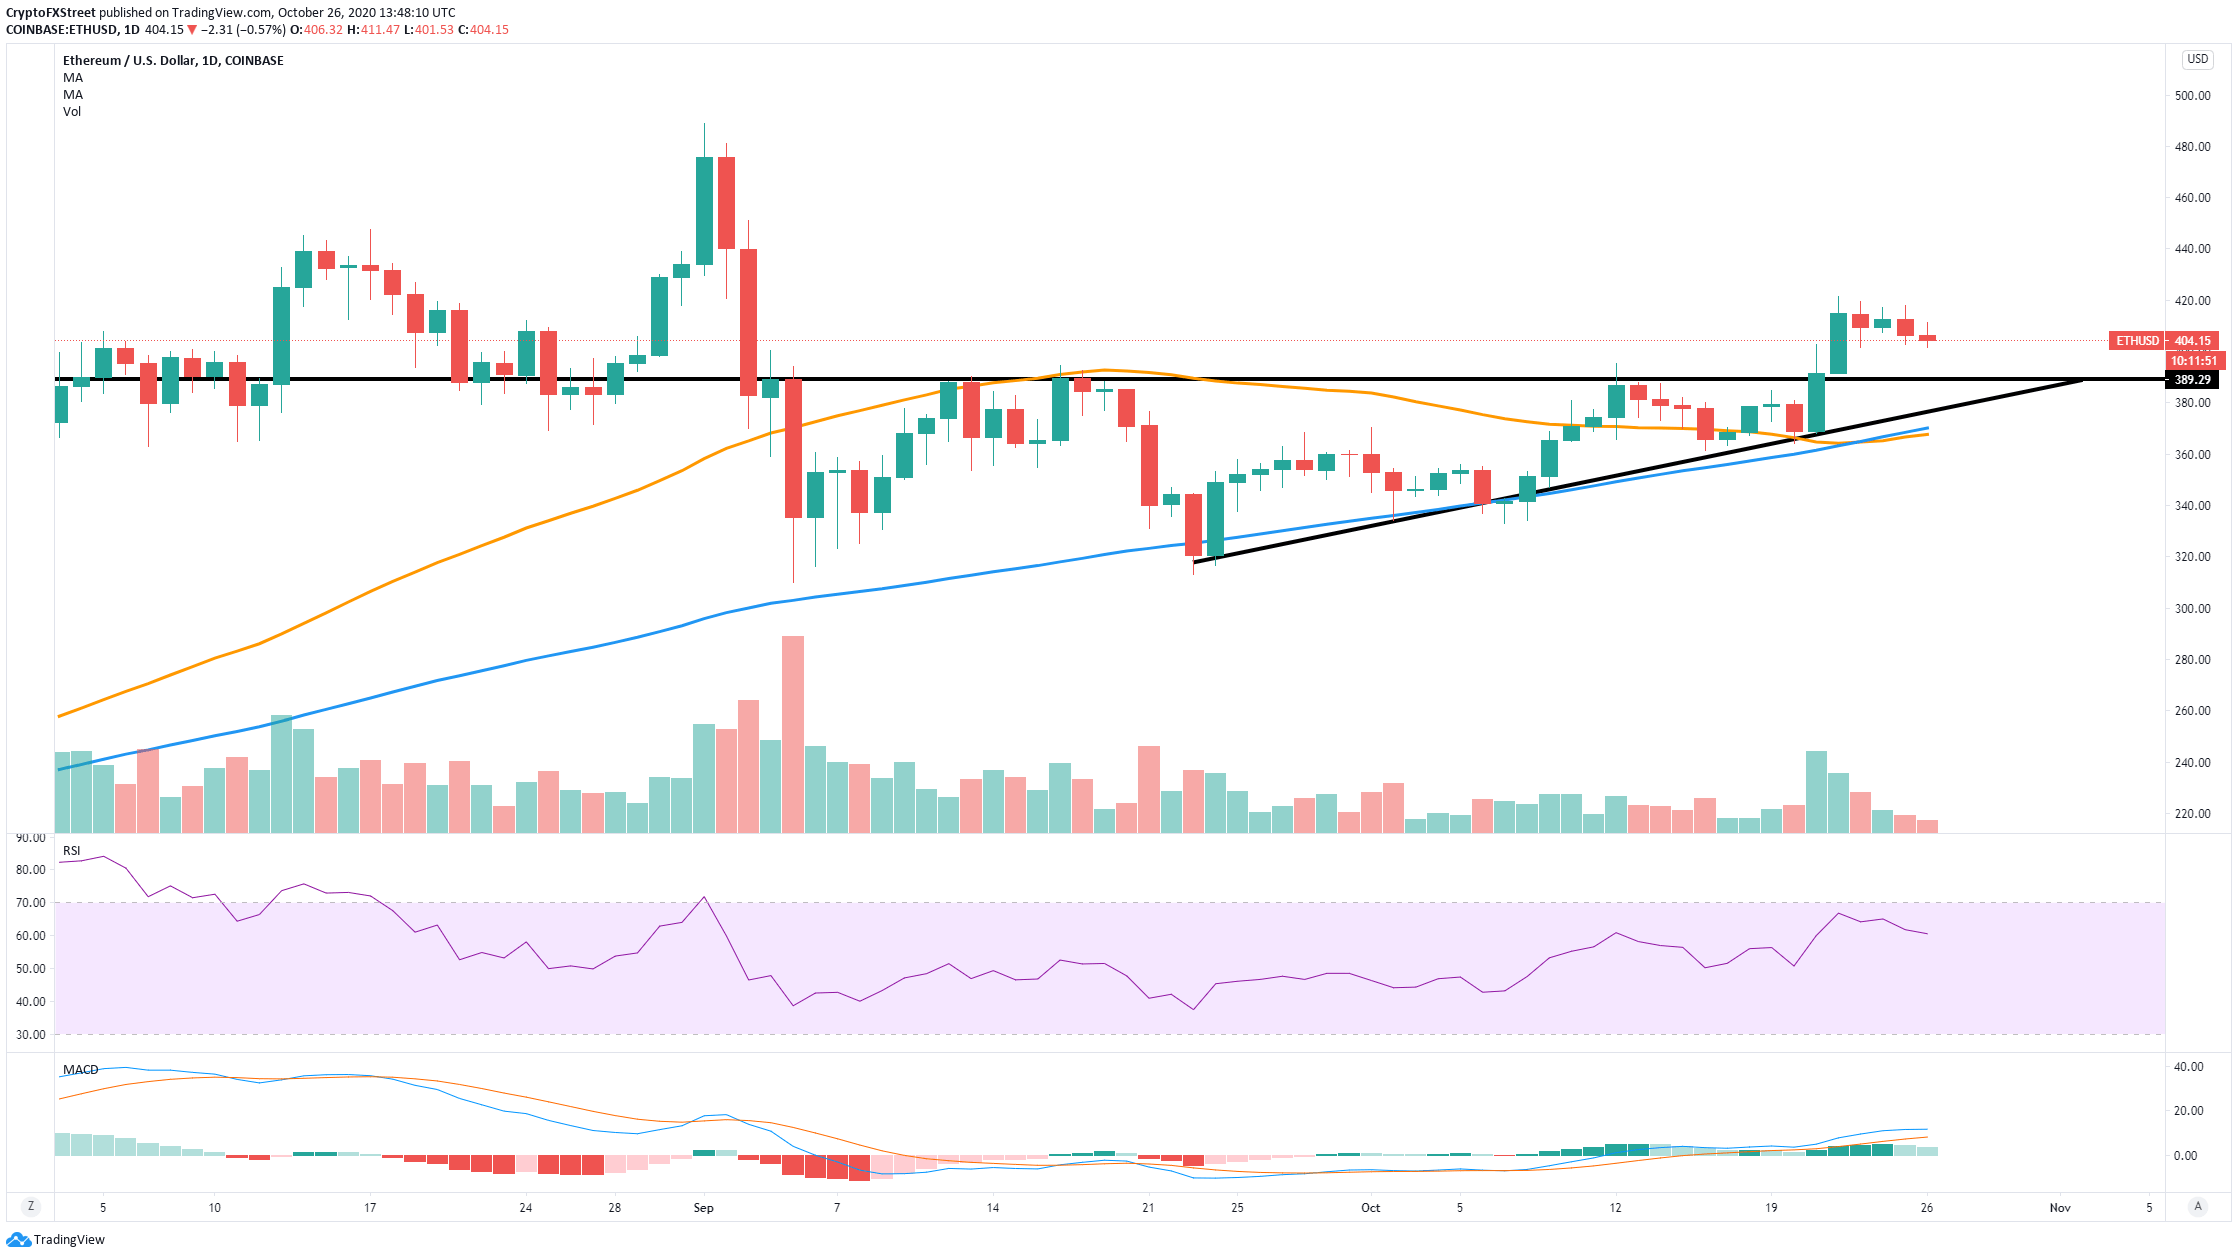
So far, the price of ETH has retraced mildly from $421 to $404 currently. The MACD remains bullish and the RSI is not overbought. The next resistance point seems to be located at $488.95, the high established on September 1.
ETH IOMAP Chart
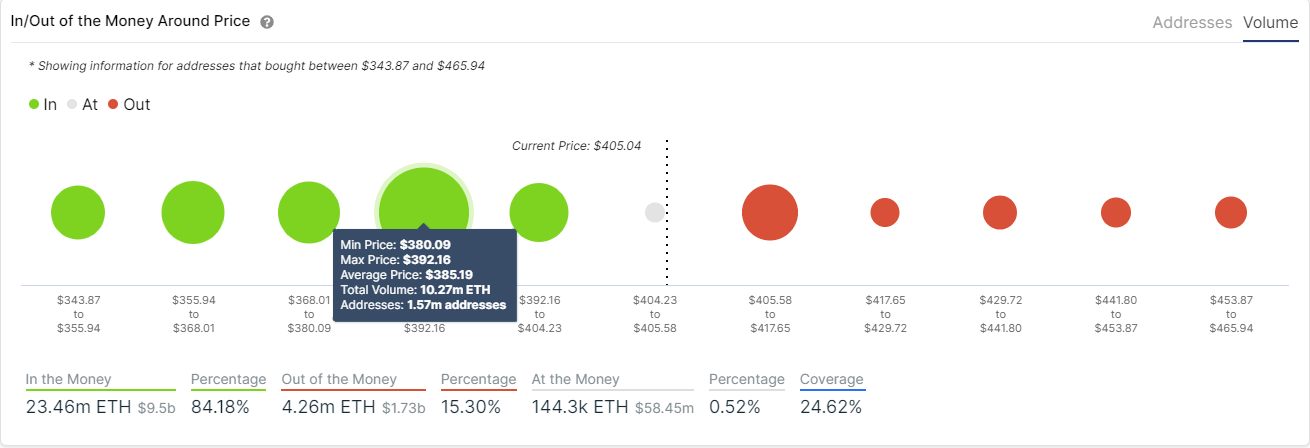
Looking at the In/Out of the Money Around Price (IOMAP) chart, we can observe very little resistance to the upside when compared to support. The most notable resistance area seems to be located between $405 and $417, which means that a breakout above this point can easily drive Ethereum towards $500.
Furthermore, according to a recent investigation by Quantstamp, the leader in blockchain security, Ethereum 2.0. is ready for launch. The firm conducted an audit of Teku, the ETH 2.0 client. Richard Ma, CEO of Quantstamp, stated:
Ethereum 2.0 is on track to deliver Phase 0 in the very near future.
The other side of the fence
Despite the current bullish momentum of Ethereum, breaking out of an ascending triangle pattern usually means that the asset will re-test the resistance trendline in the short-term before resuming the uptrend.
ETH/USD 1-hour chart
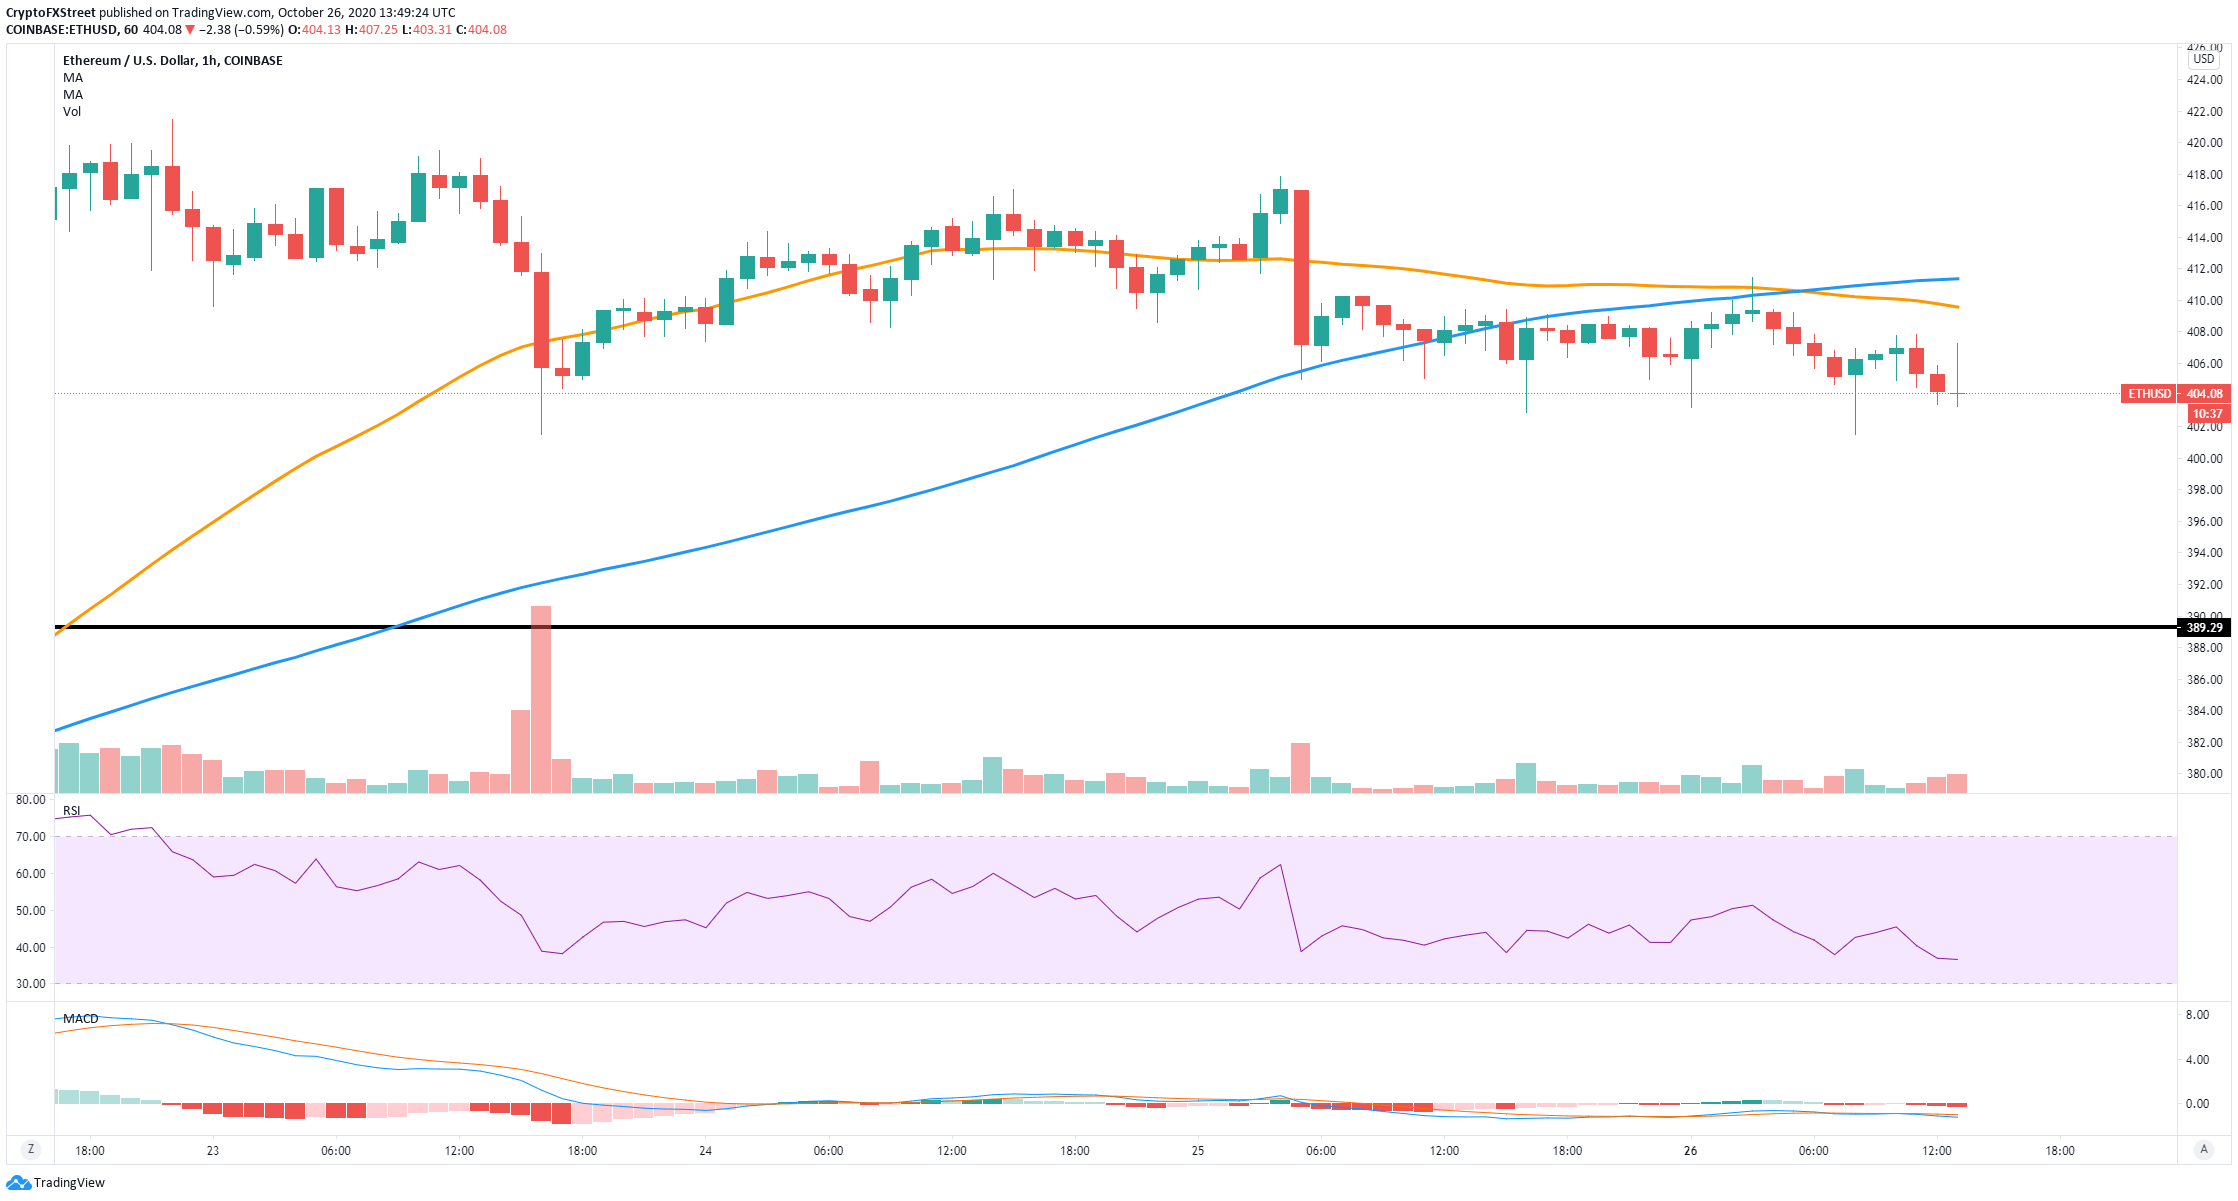
In the 1-hour chart, the bears have already taken control, confirming a downtrend. Ethereum has lost the 50-SMA and the 100-SMA support levels. The MACD also flipped bearishly and it's gaining strength. Looking at the same IOMAP chart above, we can observe that the most significant support level is located around $390, which means the smart-contracts giant can re-visit this point in the short-term.
Author

Lorenzo Stroe
Independent Analyst
Lorenzo is an experienced Technical Analyst and Content Writer who has been working in the cryptocurrency industry since 2012. He also has a passion for trading.


