Chainlink Price Prediction: LINK remains bullish but it could face a pullback
- LINK is trading at $11.97 on the verge of crossing the psychological barrier at $12.
- The digital asset is facing notable selling pressure to the upside.
-637336005550289133.jpg)
Chainlink had a massive 11% breakout in the past 24 hours, eying up that critical $12 resistance level. Bulls are in control of many timeframes; however, the digital asset still faces some hurdles on the way up.
LINK is trying to figure out which direction to take
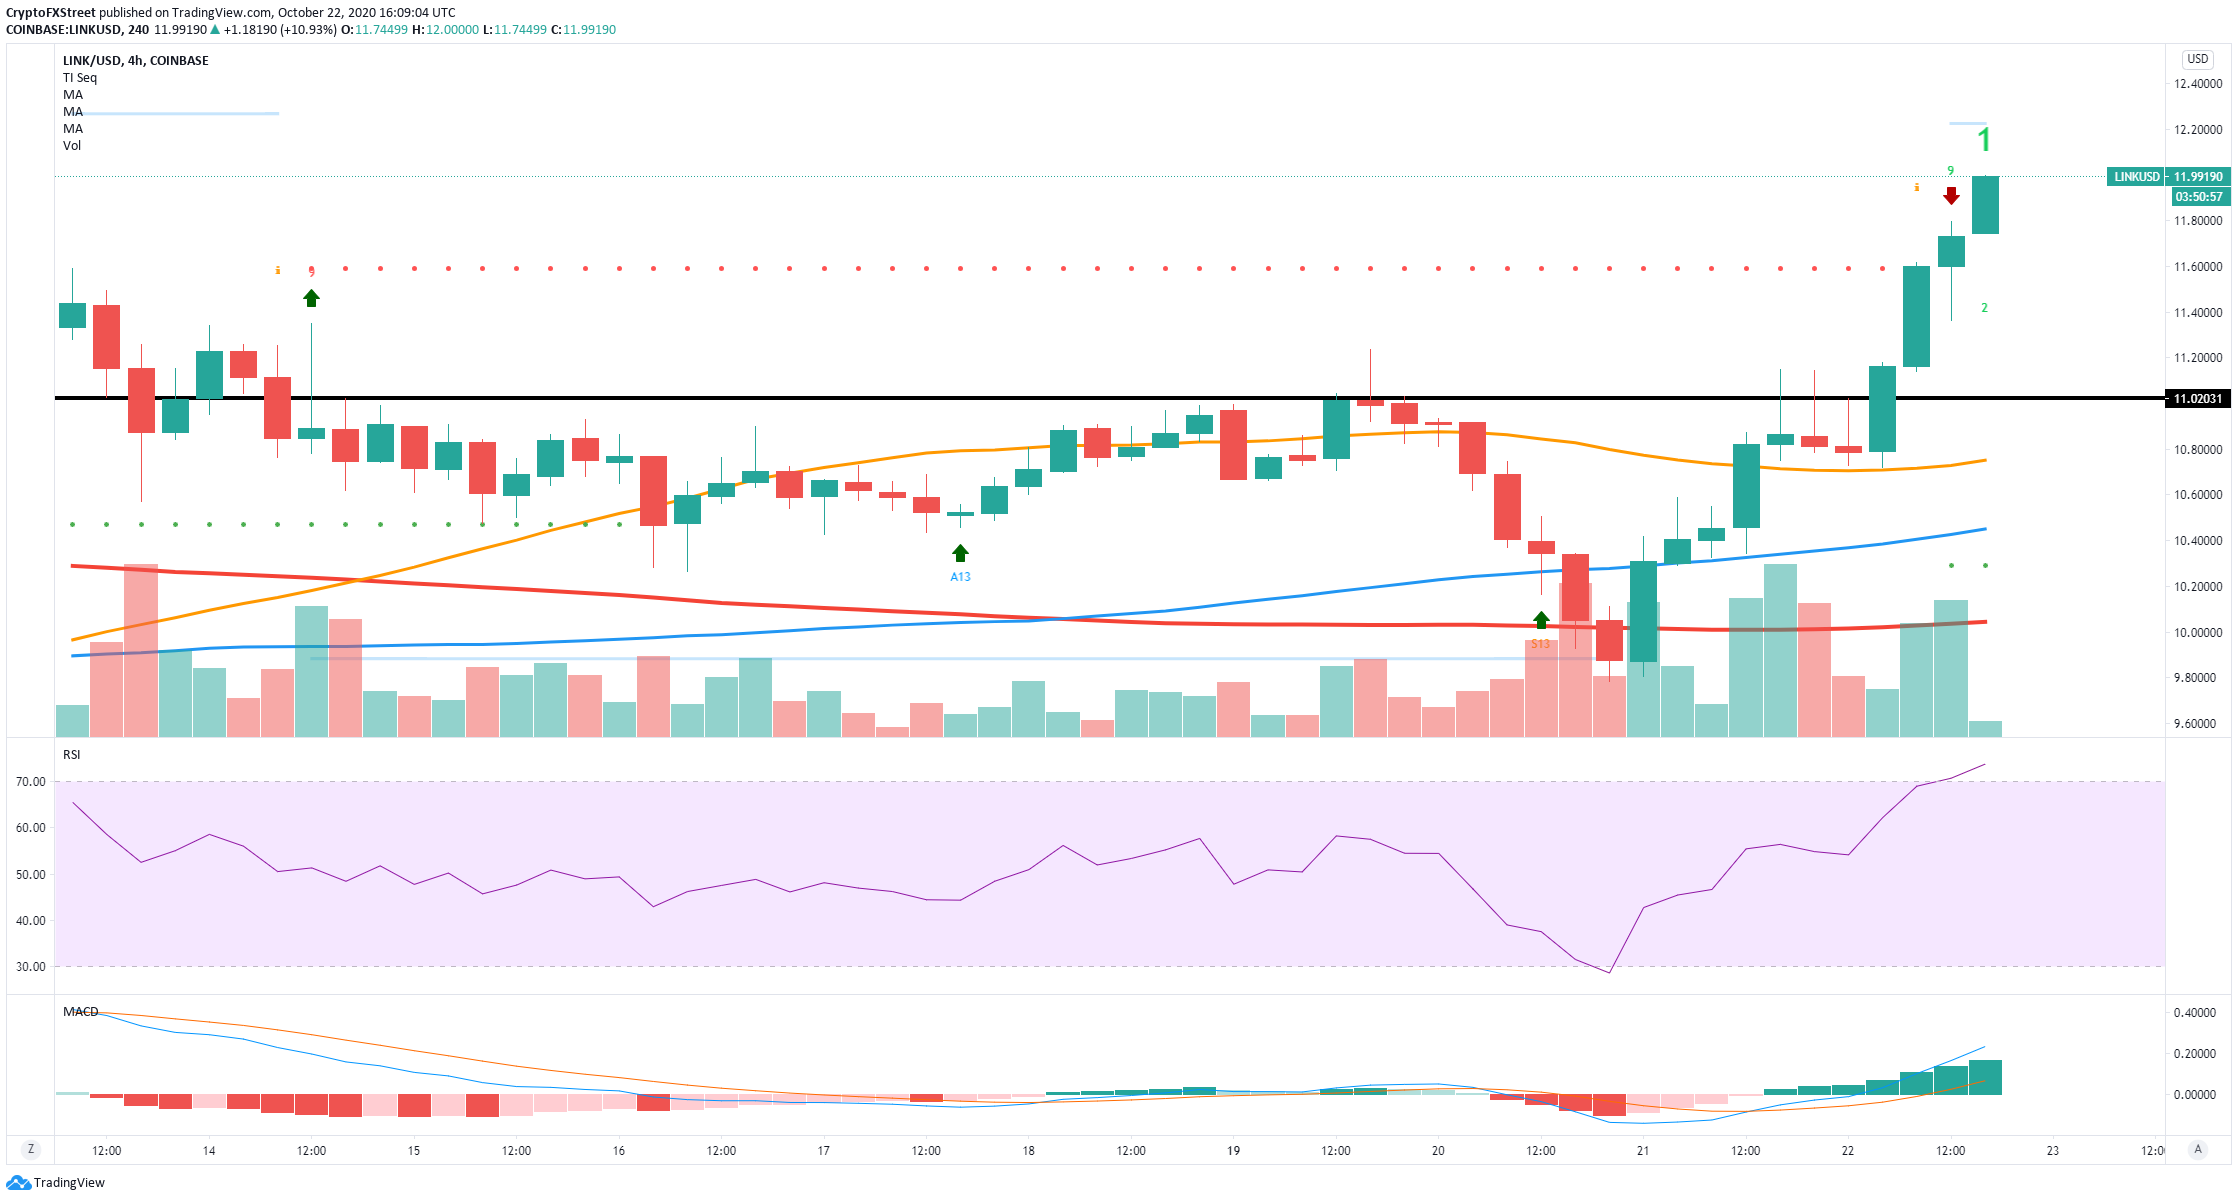
On the 4-hour chart, the TD sequential indicator presented a sell signal not yet confirmed but still powerful as the last one preceded a 13% loss within the next three days. On top of that, the RSI is overextended, adding more selling pressure.
LINK/USD 4-hour chart
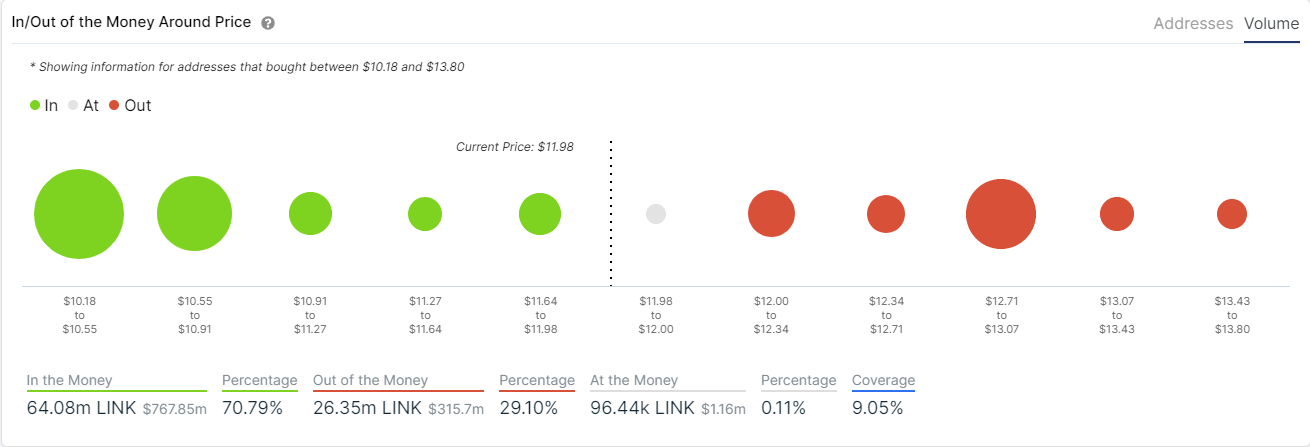
Validation of the sell signal can push the digital asset down to $10.91, according to the In/Out of the Money Around Price chart. The area between $10.55 and $10.91 is the closest support range, with 21.18 million LINK in volume.
LINK IOMAP Chart
Nonetheless, it seems that bulls are in total control over the digital asset despite the upcoming selling pressure. LINK has cracked several essential resistance levels on the daily chart, and it’s eying up $13.
LINK/USD daily chart
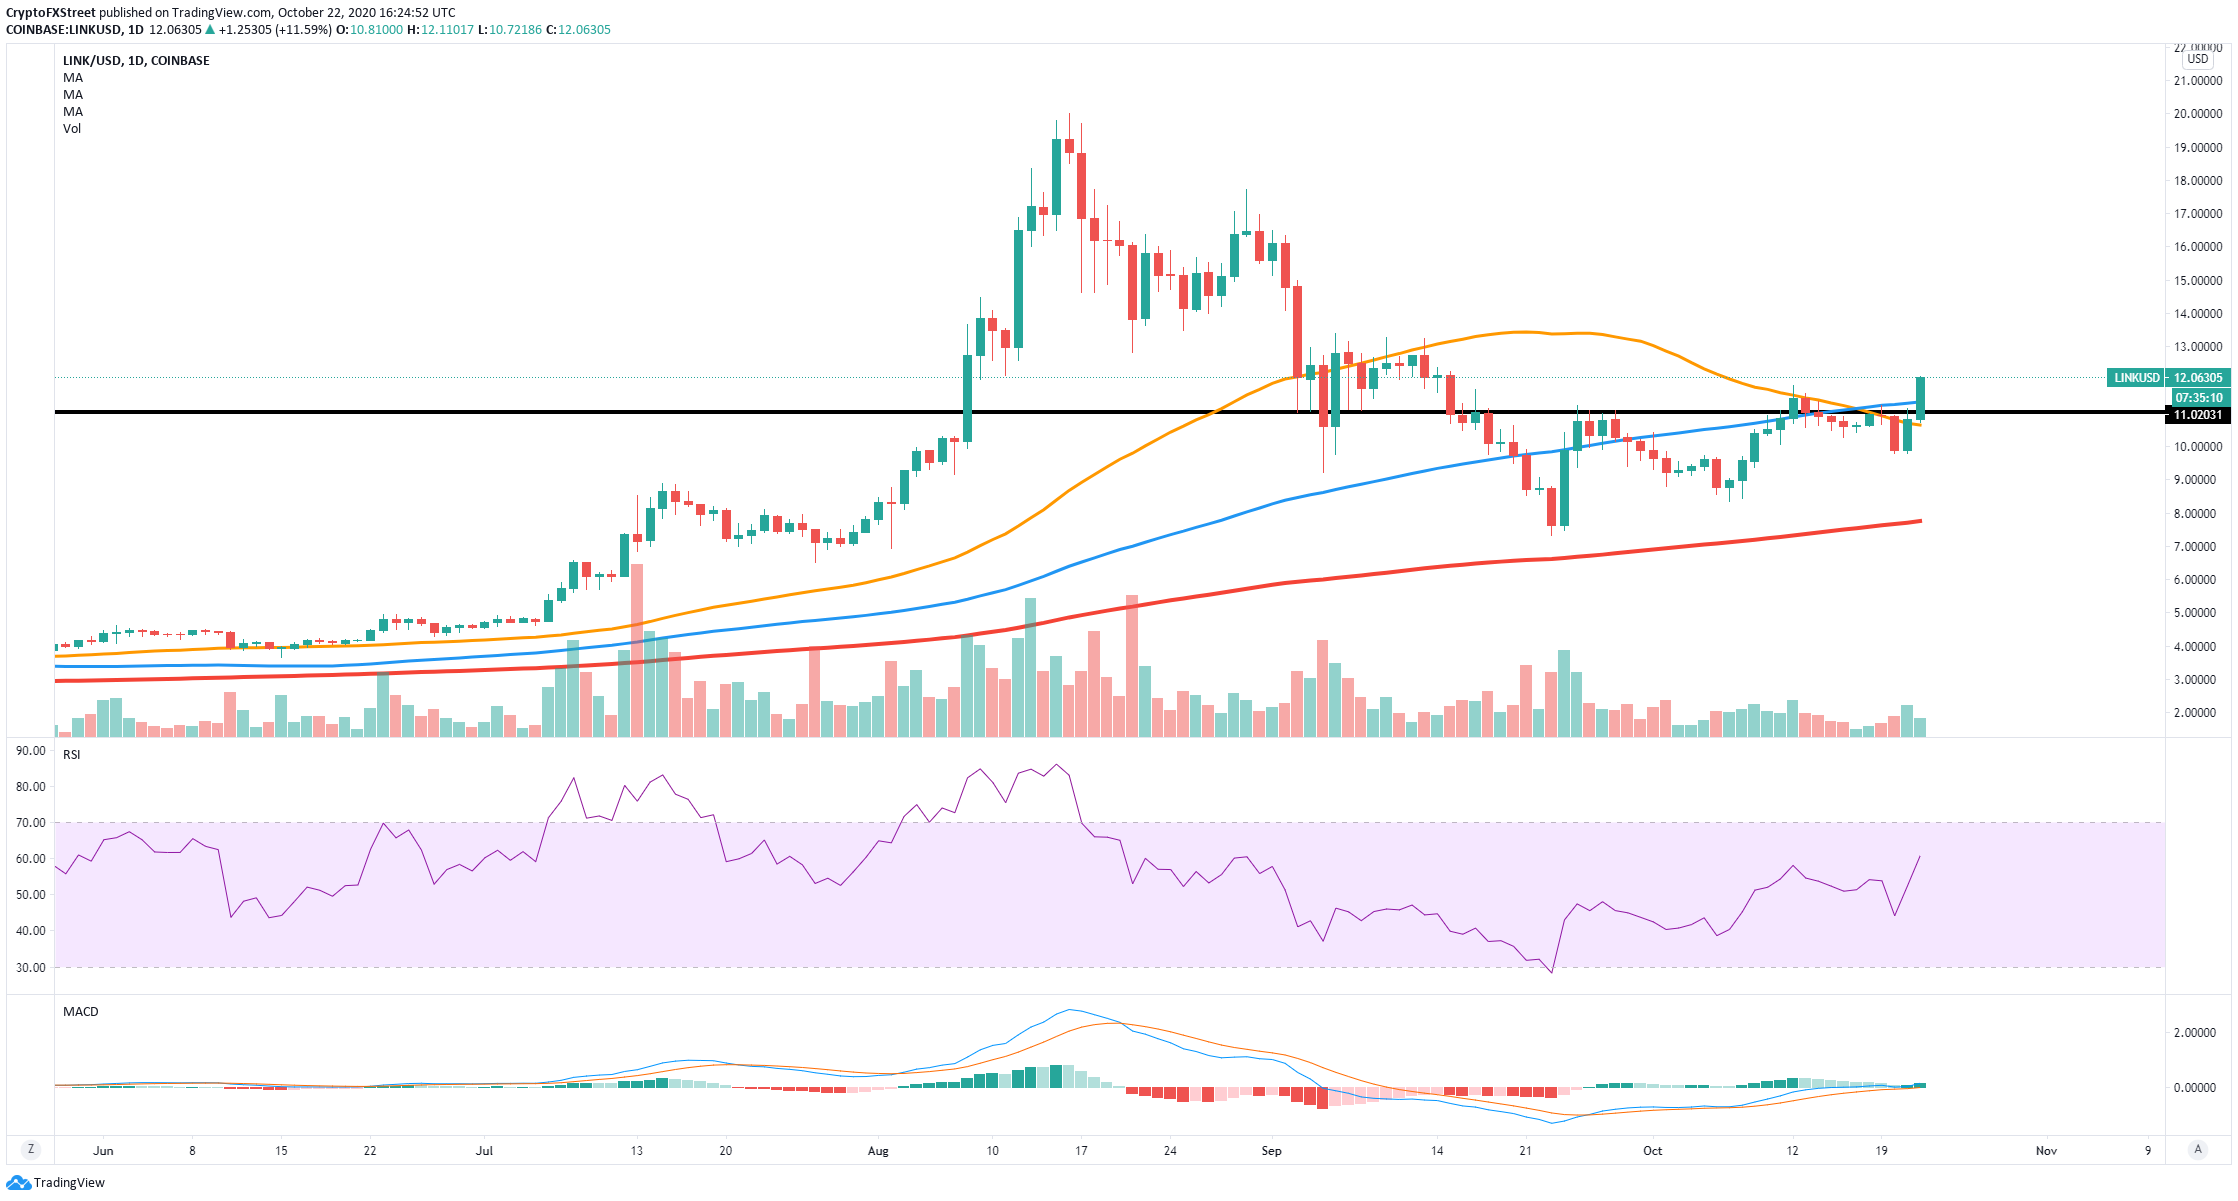
There was a substantial barrier formed at $11 on the daily chart, which has been broken. Additionally, the price of LINK climbed above the 50-SMA and the 100-SMA, turning both into support levels while the MACD continues gaining strength.
The IOMAP chart above also shows very little resistance until $12.71. The range between $12.71 and $13.07 is the strongest resistance area. A breakout above $13.07 would push LINK up to $14, according to the chart.
Important price points for Chainlink
Despite bulls being in control of LINK, selling pressure continues mounting. There is a sell signal presented on the 4-hour chart, which can drive Chainlink down to the next support area between $10.05 and $10.91.
On the other hand, if the bullish momentum continues like this, we could see LINK rise to $12.71, the next resistance point, according to the IOMAP chart. A breakout above this point would push the digital asset up to $14.
Author

Lorenzo Stroe
Independent Analyst
Lorenzo is an experienced Technical Analyst and Content Writer who has been working in the cryptocurrency industry since 2012. He also has a passion for trading.


