|

EOS technical analysis: EOS/USD charts a bearish day after three straight bullish days

  • EOS/USD fell from $3.88 to $3.75 this Tuesday.
  • Moving average convergence/divergence (MACD) indicator shows increasing bullish momentum.

EOS/USD daily chart

fxsoriginal

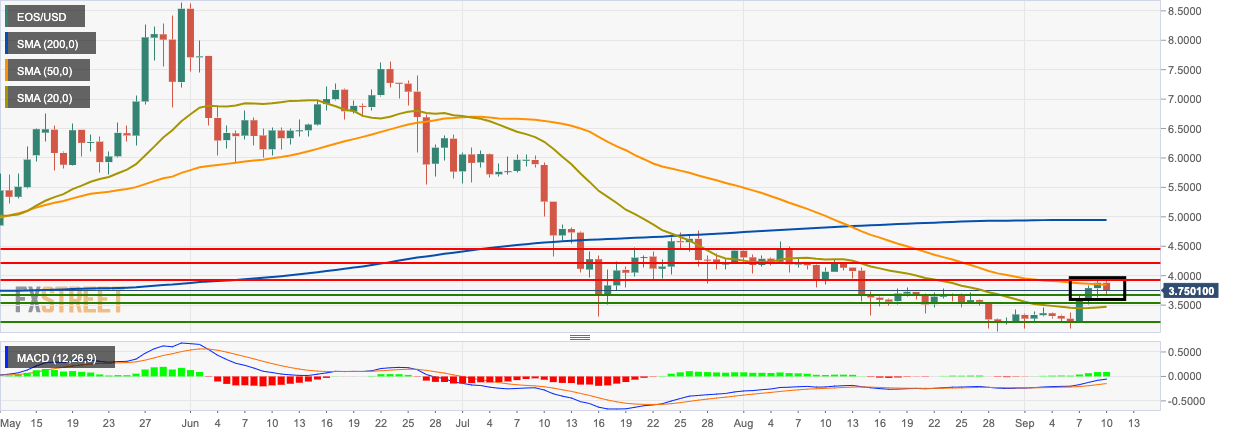
EOS/USD is currently trending in a flag formation and has gone down from $3.88 to $3.75 this Tuesday. While the price is trending above the 20-day simple moving average (SMA 20) but has found resistance at the SMA 50 curve. The moving average convergence/divergence (MACD) indicator shows increasing bullish momentum.

EOS/USD 4-hour chart

fxsoriginal

The 4-hour market has earlier had a bearish breakout from a triangle formation, but it is consolidating once again. The second last session fell below the SMA 20 curve and is trending above the SMA 50 and SMA 200 curves. The relative strength index (RSI) indicator has fallen from the overbought zone to 57.57.

EOS/USD hourly chart

fxsoriginal

The EOS/USD hourly chart fell below the 20-day Bollinger band but has since re-entered it. The price is trending below the SMA 20 curve and the Elliott oscillator has had three straight bullish sessions.

Key Levels

EOS/USD

Overview
Today last price3.7501
Today Daily Change-0.12960
Today Daily Change %-3.34
Today daily open3.8797
 
Trends
Daily SMA203.46138
Daily SMA503.85363
Daily SMA1004.91626
Daily SMA2004.94704
Levels
Previous Daily High3.9668
Previous Daily Low3.6232
Previous Weekly High3.4654
Previous Weekly Low3.1068
Previous Monthly High4.5778
Previous Monthly Low3.06
Daily Fibonacci 38.2%3.83554
Daily Fibonacci 61.8%3.75445
Daily Pivot Point S13.67966
Daily Pivot Point S23.47963
Daily Pivot Point S33.33606
Daily Pivot Point R14.02327
Daily Pivot Point R24.16684
Daily Pivot Point R34.36687


Author

Rajarshi Mitra

Rajarshi Mitra

Independent Analyst

Rajarshi entered the blockchain space in 2016. He is a blockchain researcher who has worked for Blockgeeks and has done research work for several ICOs. He gets regularly invited to give talks on the blockchain technology and cryptocurrencies.

More from Rajarshi Mitra
Share:

Editor's Picks

Ripple slides to $1.45 as downside risks surge

Ripple edges lower at the time of writing on Tuesday, from the daily open of $1.48, as headwinds persist across the crypto market. A short-term support is emerging at $1.45, but a buildup of bearish positions could further weaken the derivatives market and prolong the correction.

Bitcoin slips below $68,000 as defensive stance limits recovery

Bitcoin edges lower on Tuesday, extending consolidation in a trading range for over ten days. Market conditions remain defensive, with sustainable recovery depending on renewed spot demand, report says.

Crypto Today: Bitcoin, Ethereum, XRP upside looks limited amid deteriorating retail demand

The cryptocurrency market extends weakness with major coins including Bitcoin (BTC), Ethereum (ETH) and Ripple (XRP) trading in sideways price action at the time of writing on Tuesday.

Meme Coins Price Prediction: Bears push Dogecoin, Shiba Inu, Pepe to the ropes

Meme coins, including Dogecoin, Shiba Inu, and Pepe, are under pressure on Tuesday, extending Sunday’s decline. The derivatives data show substantial outflows from DOGE, SHIB, and PEPE futures Open Interest, primarily driven by long-side-skewed liquidations. 

Bitcoin Price Annual Forecast: BTC holds long-term bullish structure heading into 2026

Bitcoin (BTC) is wrapping up 2025 as one of its most eventful years, defined by unprecedented institutional participation, major regulatory developments, and extreme price volatility.

Bitcoin: BTC bears aren’t done yet

Bitcoin (BTC) price slips below $67,000 at the time of writing on Friday, remaining under pressure and extending losses of nearly 5% so far this week.