Elrond price should pull back, but EGLD wants a 40% rally
- Elrond price secures support at the 200-day simple moving average (SMA), keeping the multi-week rally intact.
- EGLD intra-day charts showing a bearish momentum divergence as Elrond price strikes a new high.
- Four consecutive positive weeks marks the first time since the final leg of the 2021 advance in early April.

Elrond price has gained 118.48% since July 21, listing it as one of the better performing cryptocurrencies since the rally began. In the process, EGLD shredded the resistance at $113.09, overcame the 200-day SMA and tagged the 38.2% and 50% Fibonacci retracement levels at $128.21 and $151.70, respectively. Moving forward, the presence of a bearish momentum divergence on various timeframes suggests that any upward resolution from the recent price compression may be temporary.
Elrond price proves that a bull market waits for no one
At the end of June, Elrond price discovered support at the topside trend line running from the July 2019 high through the August 2020 high on a weekly closing basis. It has since recorded five positive weekly closes out of the last seven weeks. The relative strength was evident in July as EGLD did not come close to printing a new correction low like many of the cryptocurrencies.
The power of Elrond price has carried the daily Relative Strength Index (RSI) into an overbought reading, while the intraday RSI versions are showing a bearish momentum divergence, meaning that the RSI is not confirming the EGLD price highs. The appearance of the bearish divergence is a point of concern in the short term and may interrupt today’s developing breakout from a tight price range.
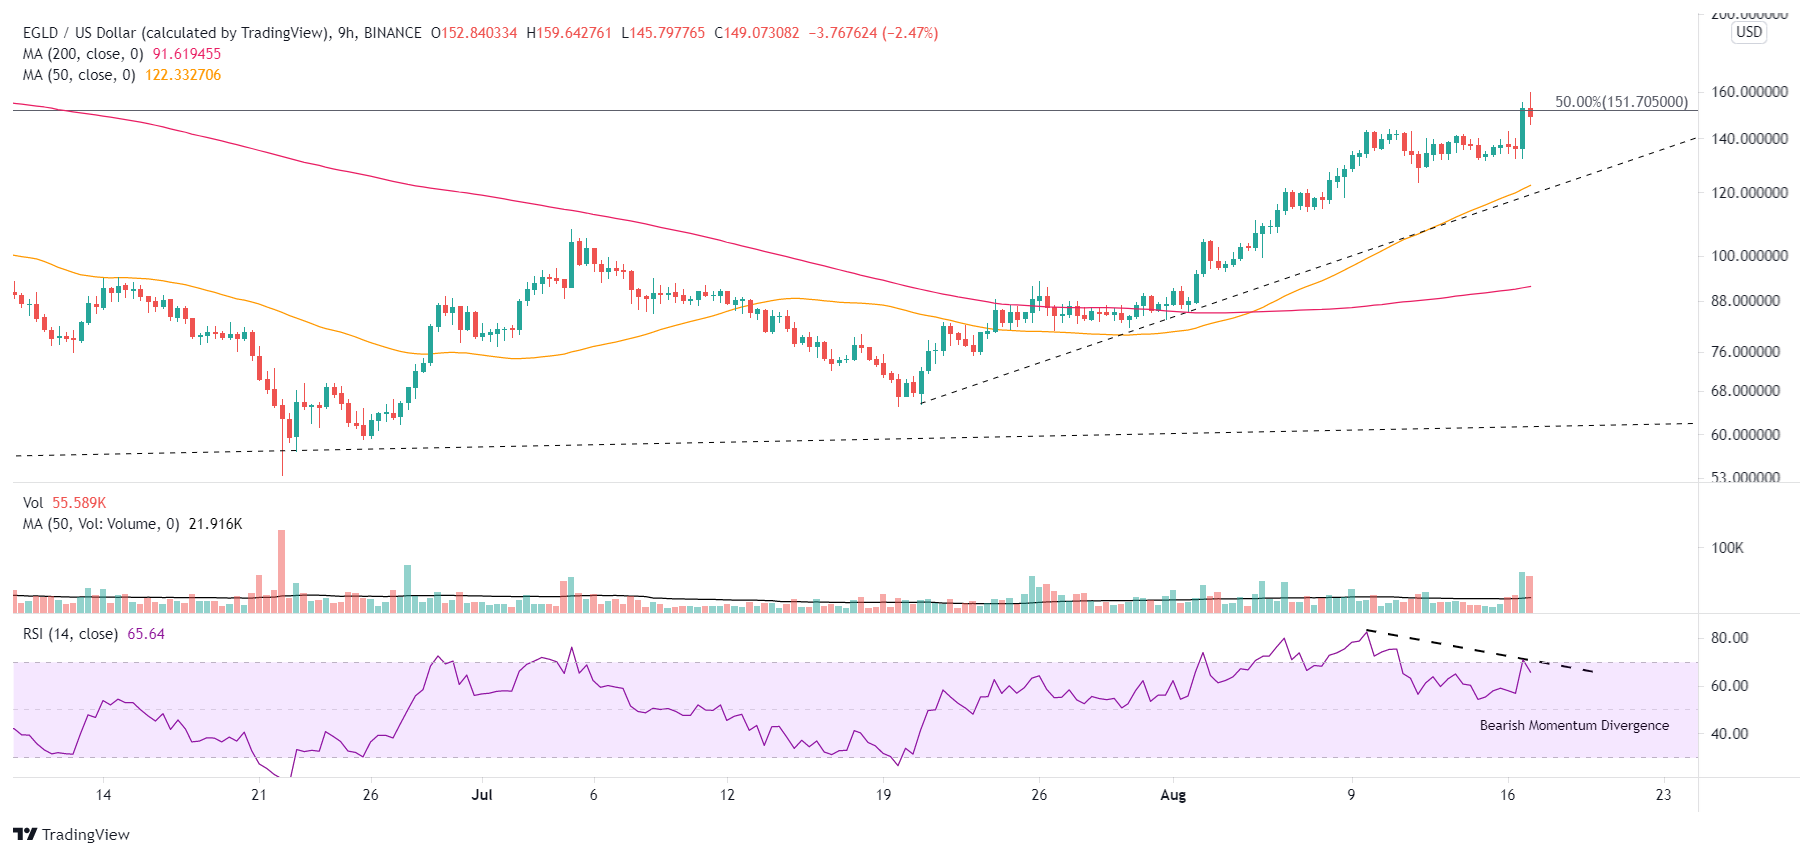
EGLD/USD 9-hour chart
A bearish momentum divergence does not signify that a large correction is near but that the momentum behind a move is waning, making fresh highs a challenge. Elrond price could shake off the divergence and march higher. Still, if it enters a consolidation, it is likely to be shallow, meeting formidable support at the union of the 38.2% retracement level at $128.21 with the 200-day SMA at $126.30, equalling a 14% pullback from the current EGLD price.
If Elrond price does log a daily close below the 200-day SMA, it will not find support until the July 5 high of $113.09 or the 50-day SMA at $97.65. In either of the two scenarios, the EGLD price structure will become more complicated, exposing the digital token to various outcomes, including a test of the July low of $64.12.
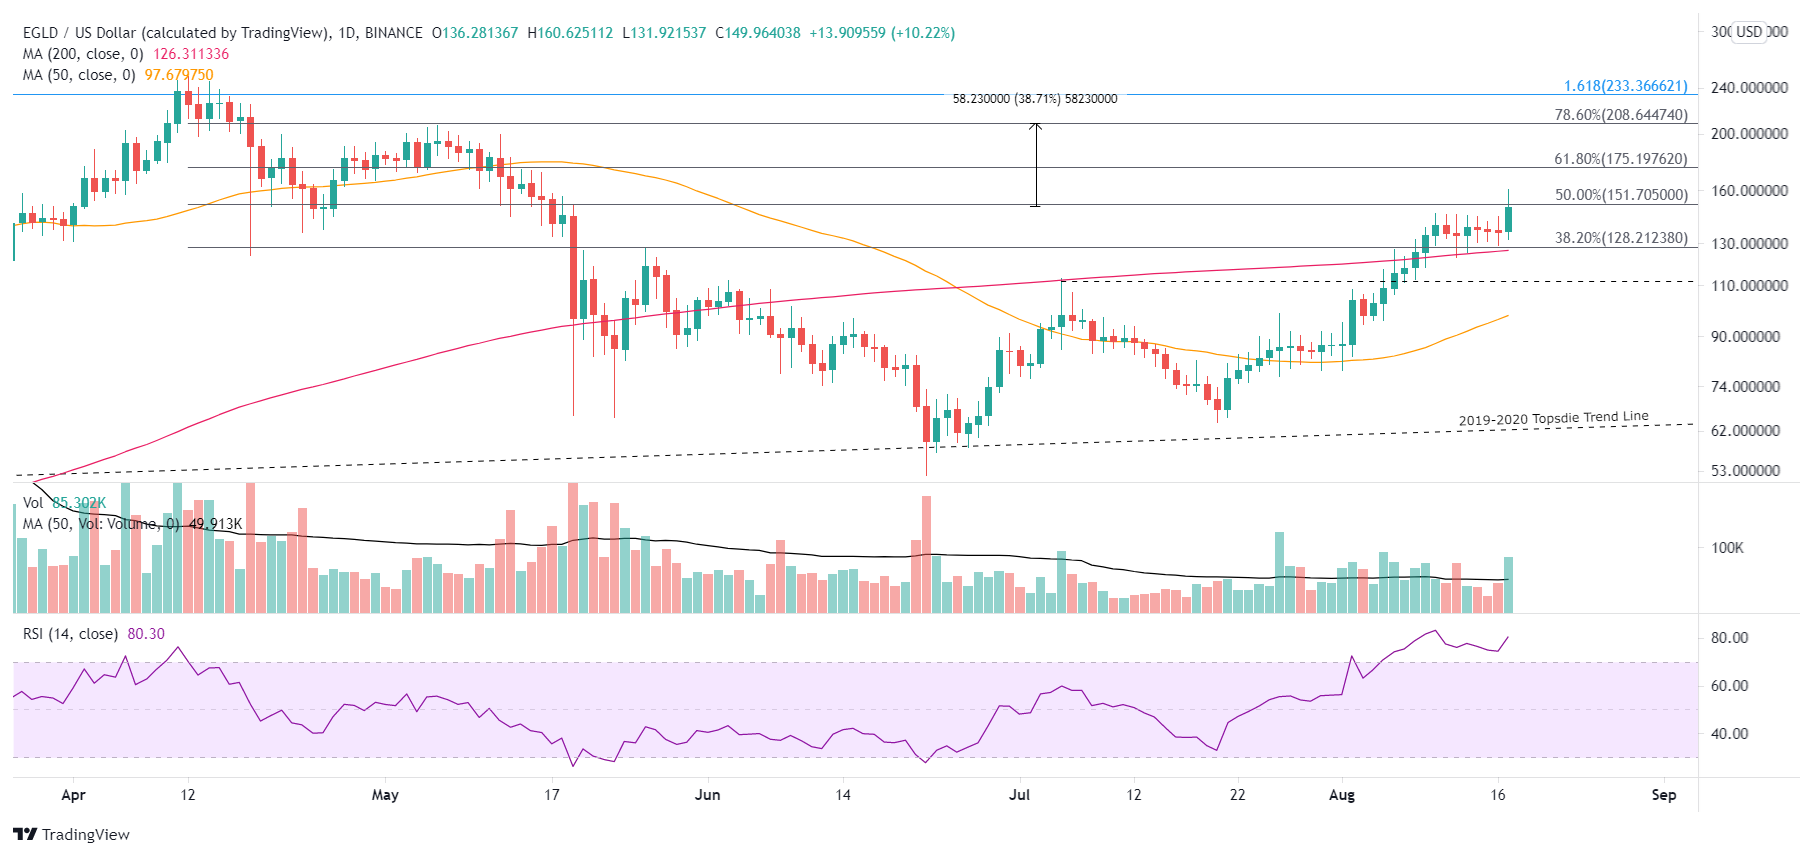
EGLD/USD daily chart
Today, Elrond price appears to be trying to rediscover the previous momentum, which could void the bearish momentum divergence if sustained in the coming days. Identifiable EGLD targets include the 61.8% retracement at $175.20, but more likely is the confluence of the May 6 high of $207.23 with the 78.6% retracement at $208.64, yielding a 39% gain from the current price.
The RSI on the intra-day charts suggests that Elrond price will proceed with a consolidation or correction, albeit shallow. However, despite the technical warning signs, the magnitude of today’s advance seems to contradict a short-term bearish narrative and projects that EGLD is primed to pursue higher prices. Hence, the next couple of days are crucial.
Author

Sheldon McIntyre, CMT
Independent Analyst
Sheldon has 24 years of investment experience holding various positions in companies based in the United States and Chile. His core competencies include BRIC and G-10 equity markets, swing and position trading and technical analysis.


