|

Elrond price must reclaim critical support point for a 50% move to the upside

  • Elrond price is contained inside a symmetrical triangle pattern on the 12-hour chart.
  • The digital asset is on the verge of a colossal 50% move within the next 24 hours. 
  • A key indicator has presented a strong sell signal in favor of the bears. 

Elrond has been trading inside a tightening range for the past three weeks and is poised for a massive breakout or breakdown within the next 24 hours. 

Elrond price must climb above key level to see a 50% breakout

On the 12-hour chart, Elrond is right at the end of a symmetrical triangle pattern. There is a key resistance trendline formed at $150. A breakout above this point should drive Elrond to new all-time highs at $225. 

egld price

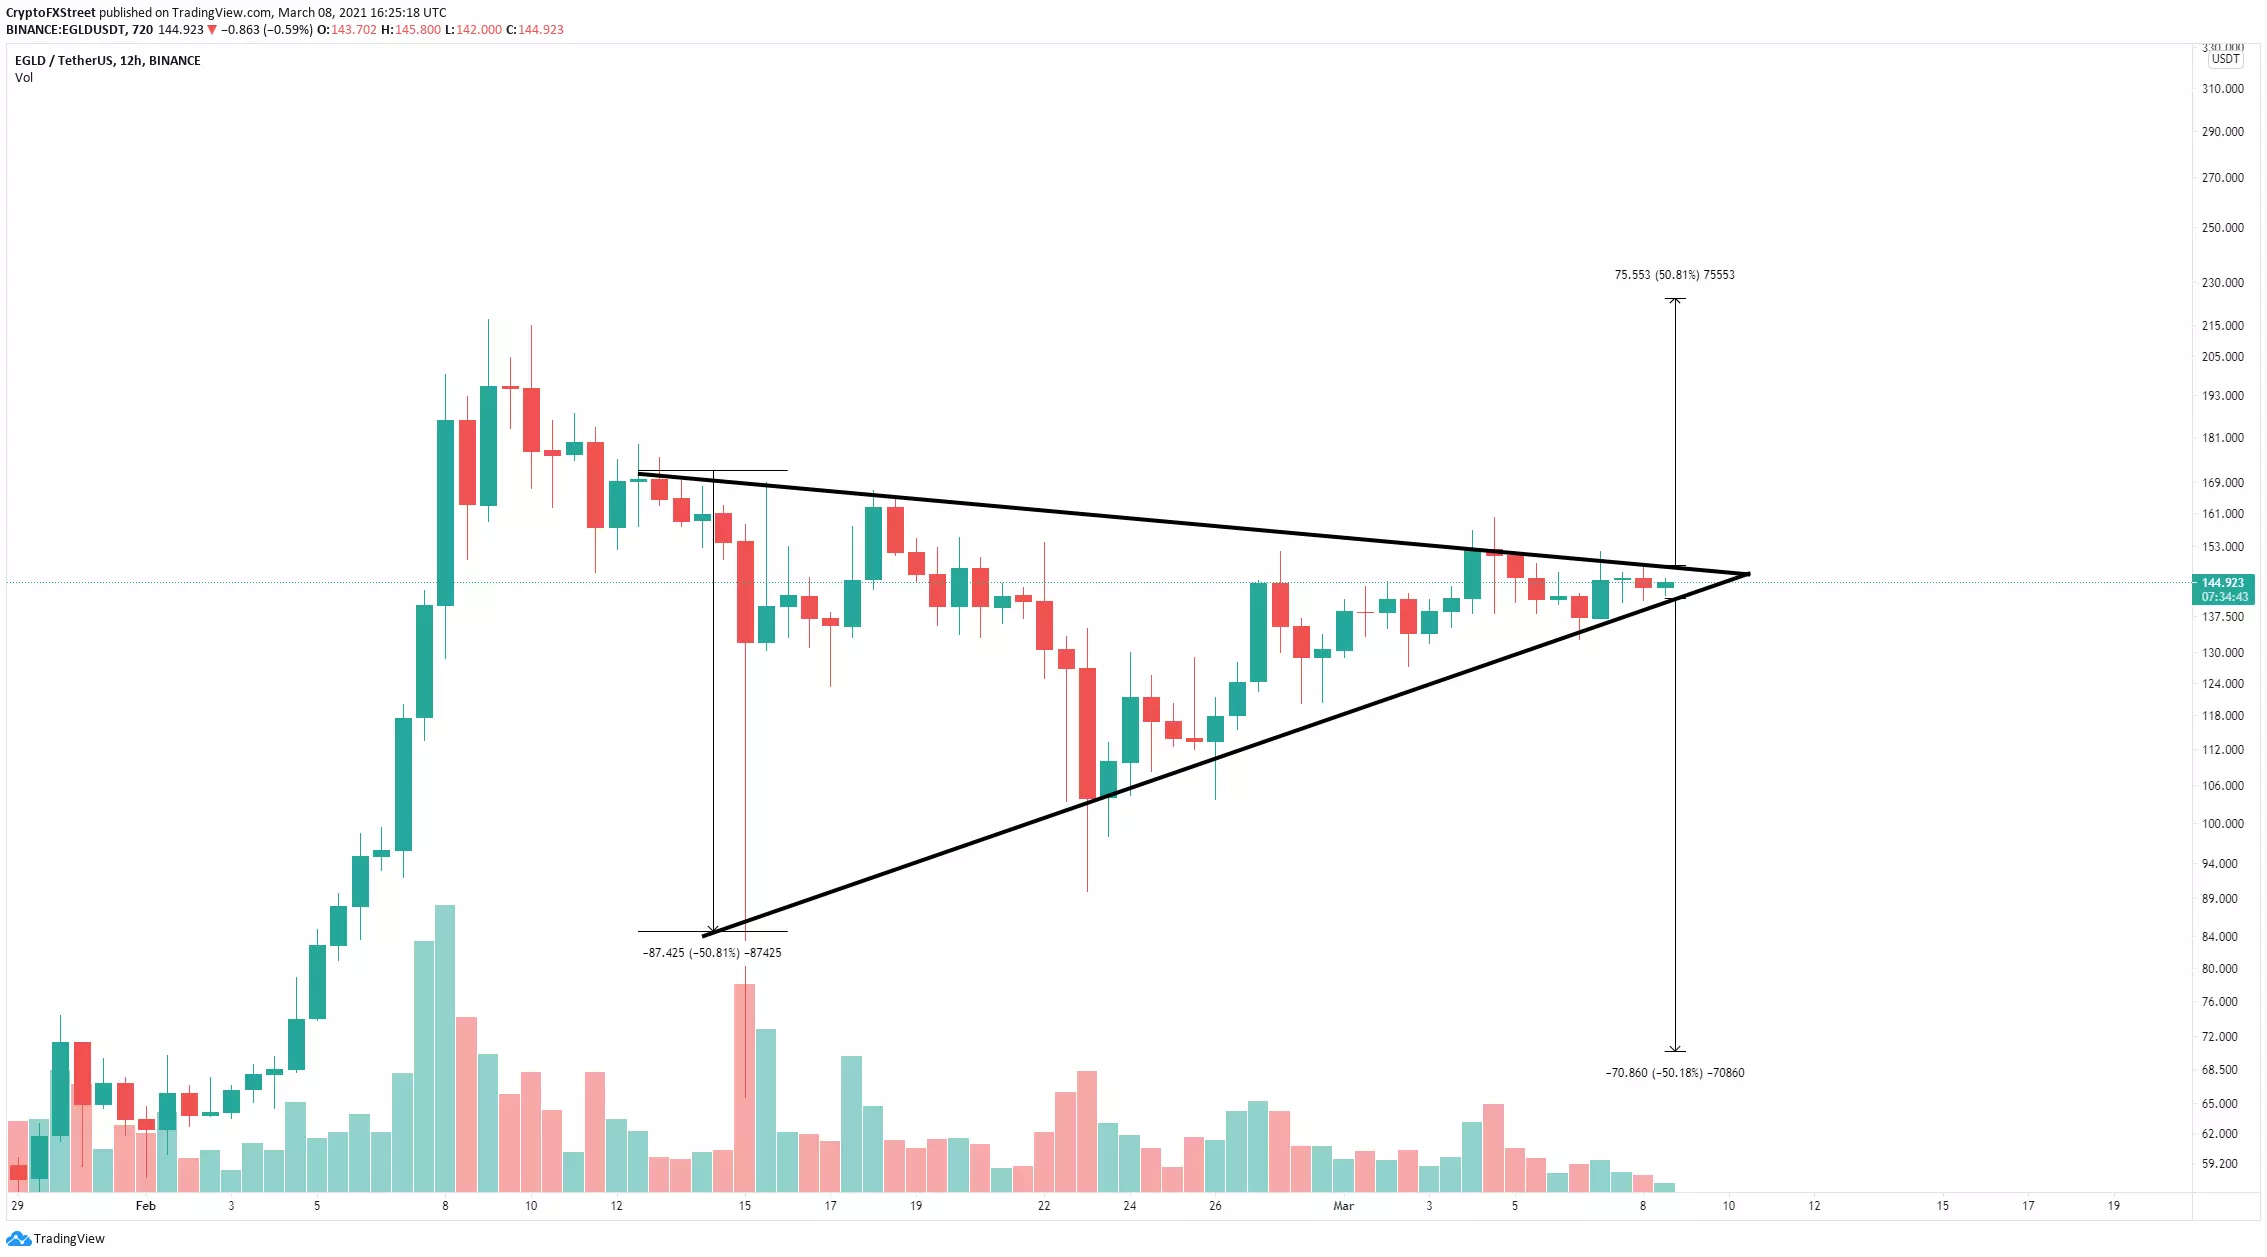
EGLD/USD 12-hour chart

The pattern is on the brink of a breakout or breakdown. The entire cryptocurrency market is bullish, which should help EGLD buyers push the digital asset above the critical point.

egld price

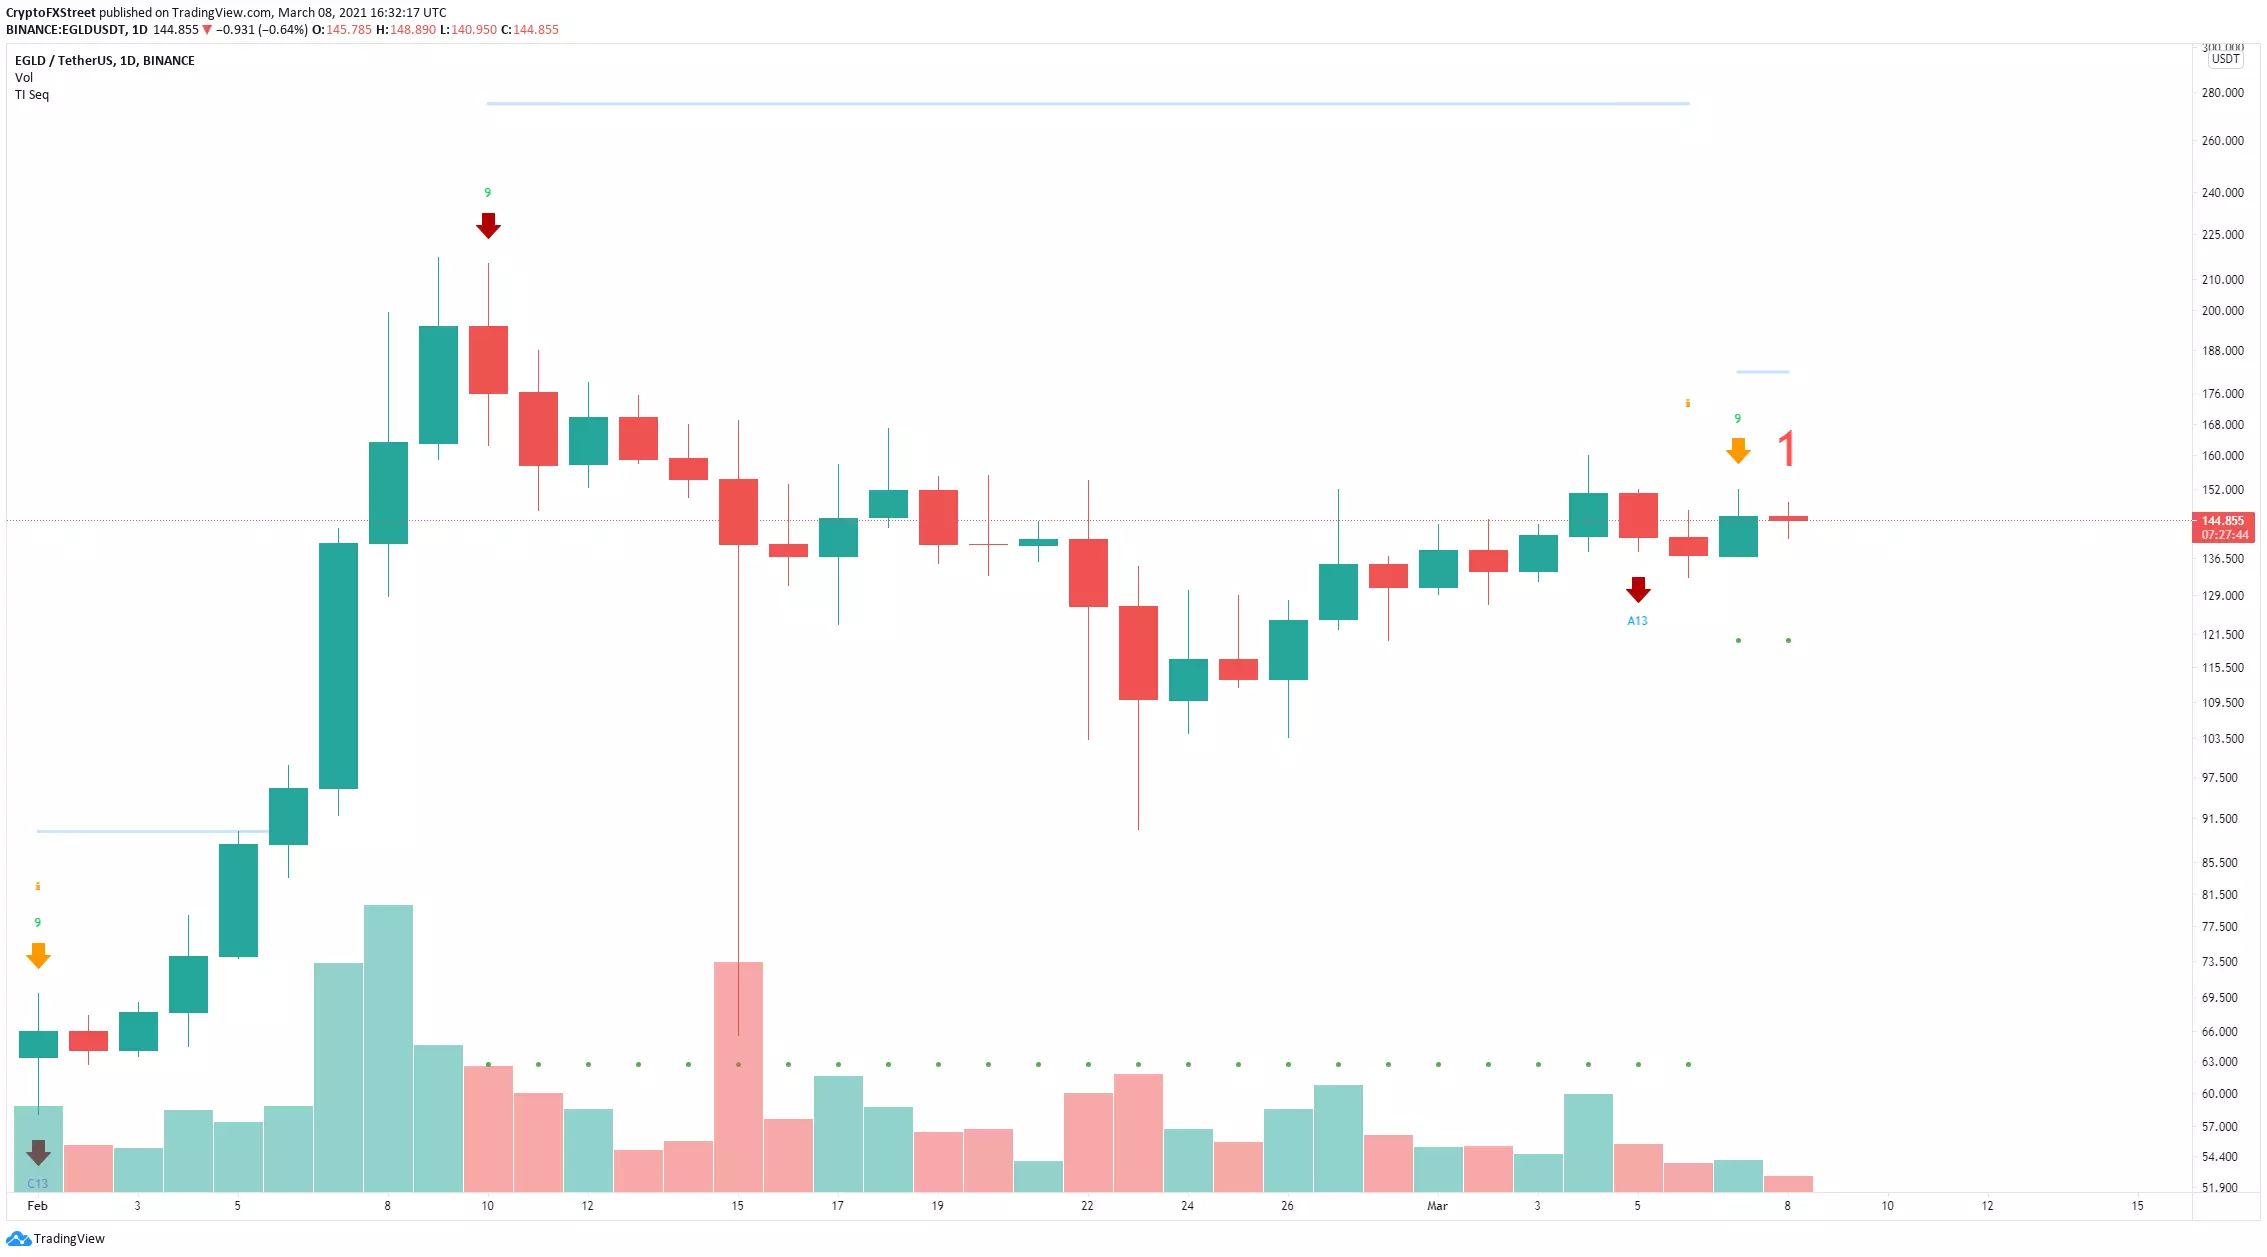
EGLD/USD daily chart

However, on the daily chart, the TD Sequential indicator has presented a sell signal giving power to the bears. A breakdown below the lower boundary of the symmetrical triangle pattern will drive Elrond price down by 50%. 

Author

Lorenzo Stroe

Lorenzo Stroe

Independent Analyst

Lorenzo is an experienced Technical Analyst and Content Writer who has been working in the cryptocurrency industry since 2012. He also has a passion for trading.

More from Lorenzo Stroe
Share:

Editor's Picks

Ripple falls below $1.20 despite Africa stablecoin payments push

XRP corrects to trade below $1.20 following early-week rejection at $1.28 and broader crypto market weakness. XRP remains under pressure from declining major moving averages, undermining the MACD buy signal.

Crypto Today: Bitcoin, Ethereum, XRP trim breakout gains as focus shifts to Fed decision

Cryptocurrency prices broadly decline as investors show caution toward risk assets ahead of the Fed's interest rate decision on Wednesday. Bitcoin (BTC) holds around $65,000 after correcting from its Monday high of $67,292.

Ondo Price Forecast: Multiple trendline rejections, fading bullish momentum warn of a steeper correction

Ondo price hovers around $0.3700 at press time on Wednesday, maintaining a broader corrective phase under the influence of a resistance trendline. Retail demand for ONDO remains firm, driven by the tokenization trend for traditional stocks and other Real World Assets.

Bitcoin steadies near $66,000 as markets await first Warsh-led Fed decision

Bitcoin steadies near $66,000 at the time of writing on Wednesday as investors await the Fed’s interest rate decision. Institutional demand shows slight improvement as spot Exchange Traded Funds recorded a mild inflow on Tuesday, after weeks of outflows.

Experts agree: Bitcoin nears bottom, but weak demand raises doubts
Bitcoin (BTC) is trading above $63,000 at the time of writing on Friday after rebounding from the key 200-week Simple Moving Average (SMA) near $62,000, a level widely viewed as key long-term support. The recovery may suggest that Bitcoin has found a floor after a sharp correction that spanned more than a month, but some warning signs persist.