Elrond Price Prediction: EGLD sets the pace for massive move beyond $200
- Elrond has started outshining other altcoins, prepares for a 40% move north.
- A technical breakout jumpstarted the bullish outlook after a short period of consolidation.
- The TD Sequential indicator is likely to present sell signals on the 4-hour, a bearish signal.

Elrond is finally breaking out after spending more than a week in consolidation within the confines of a key technical pattern. As investors rush in from the sideline, EGLD could achieve the set target and hit levels past $200.
Elrond eyes a 40% technical breakout
EGLD is exchanging hands at $152 after rebounding from the colossal dip to $90 (amid the widespread cryptocurrency losses towards the end of February). Various resistance levels, including the 200 Simple Moving Average, the 100 SMA, and the 50 SMA, were reclaimed. However, consolidation took effect with Elrond's upside capped under $145.
The formation of an ascending triangle pattern gave Elrond a bullish impulse. A breakout is usually anticipated from the triangle and has a precise target, measured from the pattern's highest to lowest points. EGLD has also commenced the 40% spike, calling out to the bulls to increase their entries and support the uptrend.
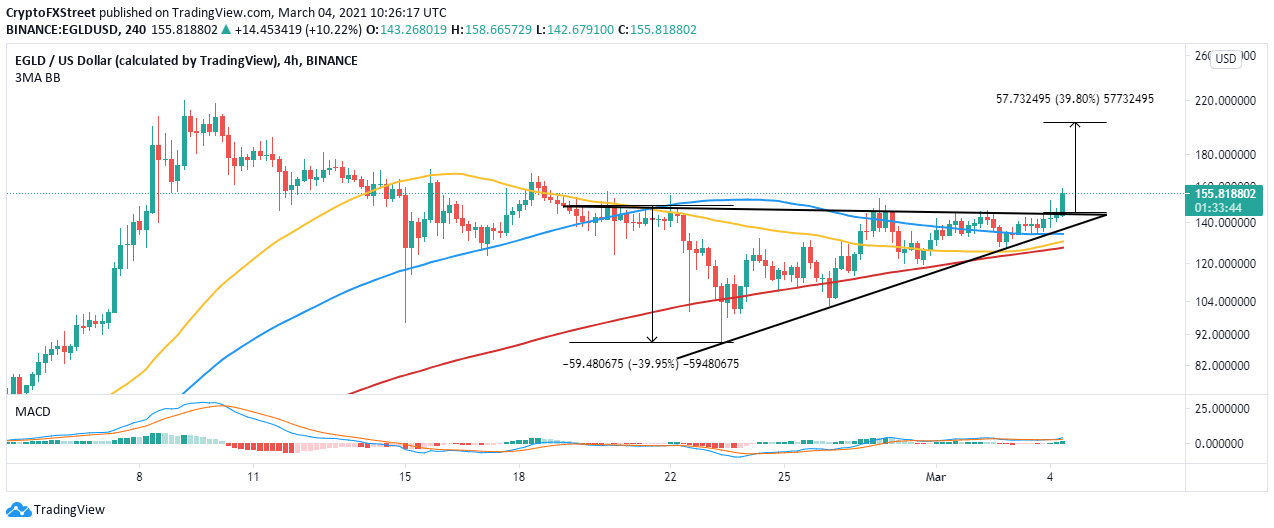
EGLD/USD 4-hour chart
The SuperTrend indicator recently flipped massively bullish for Elrond on the 4-hour chart. The signal to long the token occurred a week after the dive to $90. As long as the signal remains green and below the price, EGLD will continue to hit higher levels while heading to $200.
Consequently, the Moving Average Convergence Divergence (MACD) cements the bulls' growing influence over the price. A MACD cross above the signal line reveals that the least resistance path is upwards.
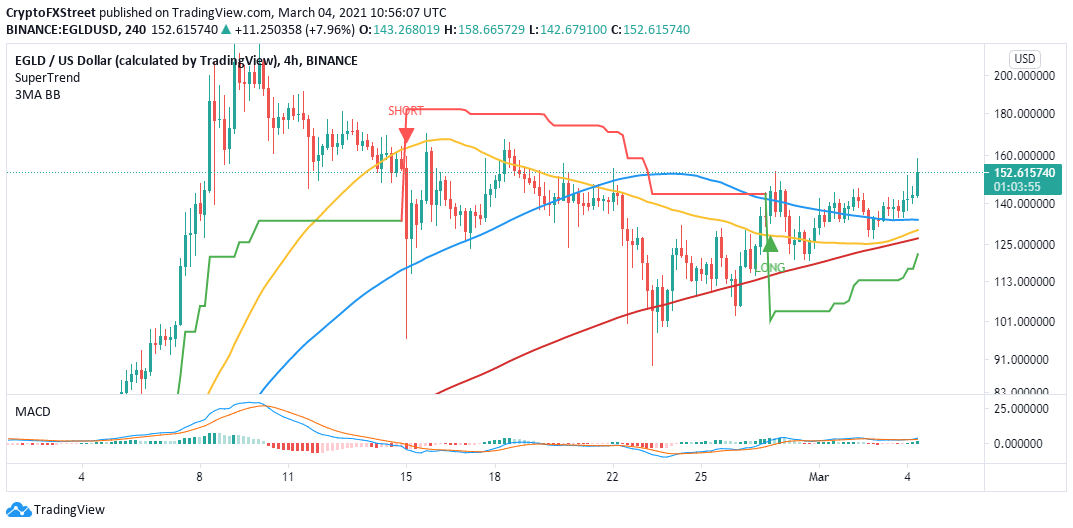
EGLD/USD 4-hour chart
Looking at the other side of the picture
The TD Sequential indicator is likely to present sell signals on the 4-hour and daily charts in the coming hours or days. The bearish calls will manifest in green nine candlesticks. If they are validated, Elrond's uptrend may lose momentum, leading to an appreciable correction.
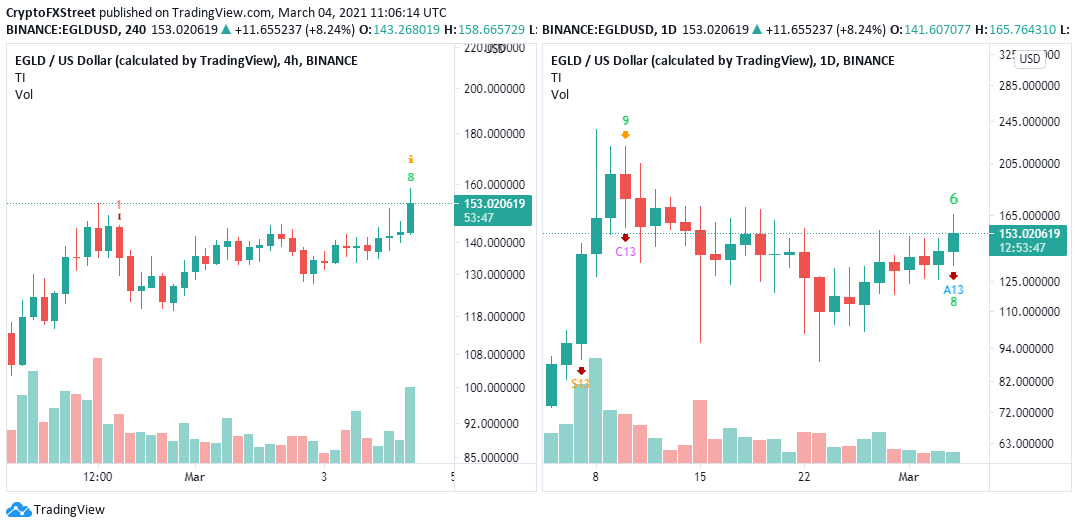
EGLD/USD 4-hour/daily charts
Elrond must also close the day above the short-term hurdle at $160 to validate the upswing to $200. On the downside, losing ground at $150 could see selling orders triggered. If push comes to shove, the tringle's x-axis will be tested before another recovery move.
Author

John Isige
FXStreet
John Isige is a seasoned cryptocurrency journalist and markets analyst committed to delivering high-quality, actionable insights tailored to traders, investors, and crypto enthusiasts. He enjoys deep dives into emerging Web3 tren


