Dogecoin price with bullish intentions, but DOGE needs resilience
- Dogecoin price discovering support at the 50-day simple moving average (SMA) as the broader market hit by selling.
- Daily and weekly Relative Strength Indexes (RSI) no longer overbought, freeing DOGE to pursue the new rally.
- IntoTheBlock IOMAP metric shows notable resistance just north of the 50-day SMA.

Dogecoin price confidently sprung from the descending channel and struck the 50-day SMA on June 1, supported by a mild increase in trading volume. The price action was repeated on June 2 with another double-digit return on higher volume. The new DOGE rally attempt, albeit at an early stage, is at an inflection point. How the meme token resolves the resistance at the tactically important moving average will have significant implications.
Dogecoin price reveals bullish intentions
Dogecoin price declined about 75% from the May 8 high at $0.760 to the May 19 low at $0.195, putting it within the ranks of the largest declines. However, the digital asset did generate a 130% bounce off the May 19 low into the May 20 high, closing DOGE back above the 50-day SMA. The moving average proved to be instructive for price action until May 28, when it declined below the symmetrical triangle’s lower trend line.
The decline below the triangle’s lower trend line on May 28 suggested that Dogecoin price would again pursue a test of the descending channel’s lower boundary. Instead, DOGE drifted lower into the channel’s midline before instigating a three-day, 50% rally into the June 2 high.
Dogecoin price needs to hold around the area of the 50-day SMA if it is to reach the channel’s measured move target of $0.625, achieving an 85% gain from the breakout and 63% from the price at the time of writing.
Three notable levels of resistance stand in front of the measured move target. Firstly, the 50% retracement of May’s deep correction at $0.477. Secondly, the 61.8% retracement at $0.544 and finally, the May 14 high at $0.604. If the market mood is cooperative, Dogecoin price could reach the 78.6% retracement before a new, meaningful pullback materializes.
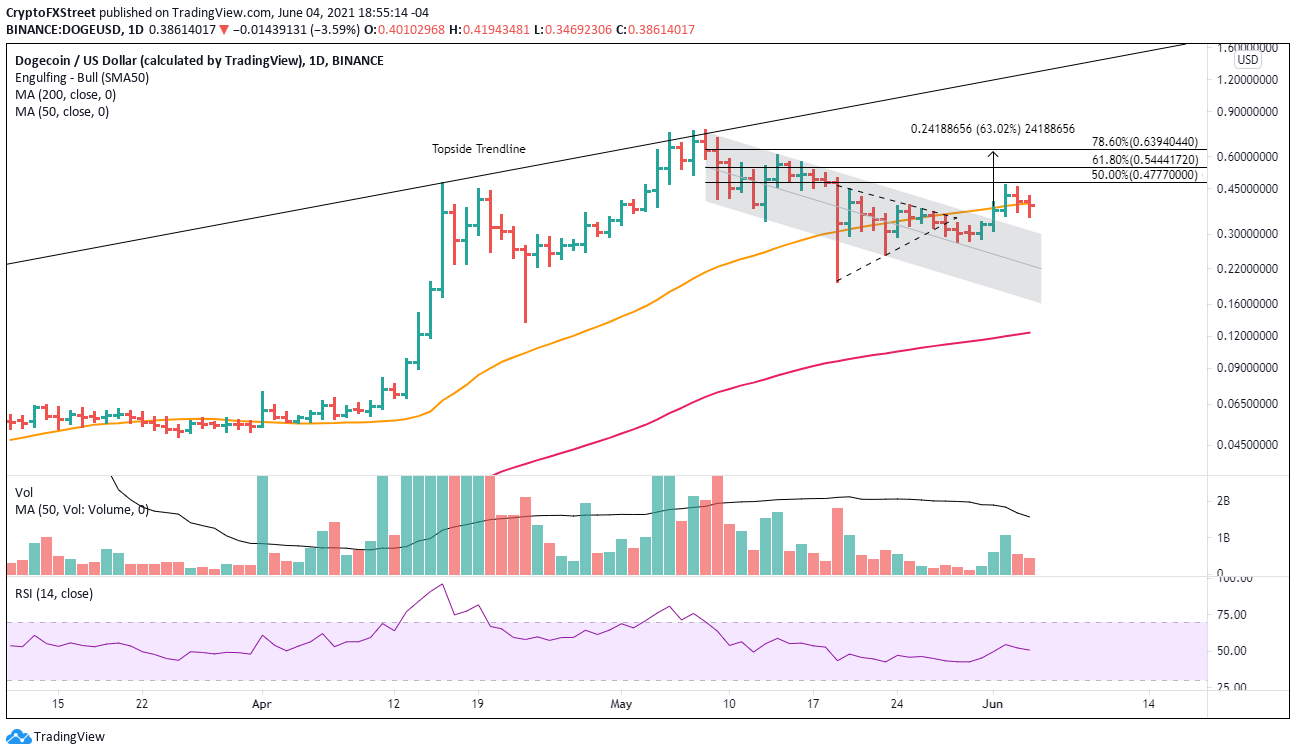
DOGE/USD daily chart
An inability to hold the 50-day SMA will increase the probability that Dogecoin price will test the channel’s upper boundary at $0.310. If DOGE can not hold the boundary, the digital asset may fall deep into the channel, testing the midline at $0.226.
The IntoTheBlock In/Out of the Money Around Price (IOMAP) metric provides an interesting picture of Dogecoin price.
Base on the metric, there is formidable resistance just above the 50-day SMA, where 44.17k addresses hold 7.35 billion DOGE at an average price of $0.410. The moving average currently sits at $0.395.
As for support, the IOMAP shows minor clusters of support down to $0.326 where only 21.96k addresses hold 1.68 billion DOGE at an average price of $0.333, suggesting that Dogecoin price may easily fall to the channel’s upper boundary.

DOGE IOMAP - IntoTheBlock
Based on the charts and combined with the IOMAP metric, DOGE investors should expect a bounce above the 50-day SMA to be at least a short-term challenge. Any augmentation in selling will find little support until the channel’s upper boundary.
Considering the gloomy day in the cryptocurrency complex and the much-discussed peril of weekend trading, DOGE investors should seek resilience from the cryptocurrency before concluding any new investment decisions.
Author

Sheldon McIntyre, CMT
Independent Analyst
Sheldon has 24 years of investment experience holding various positions in companies based in the United States and Chile. His core competencies include BRIC and G-10 equity markets, swing and position trading and technical analysis.


