Dogecoin price crushes resistance, pursues 20% gain
- Dogecoin price sliced through descending channel’s upper boundary on June 2, beginning a new trend.
- DOGE volume finally responds, growing over the last three trading days.
- Declining active addresses and tight correlation to Bitcoin are a shadow over the emerging rally.

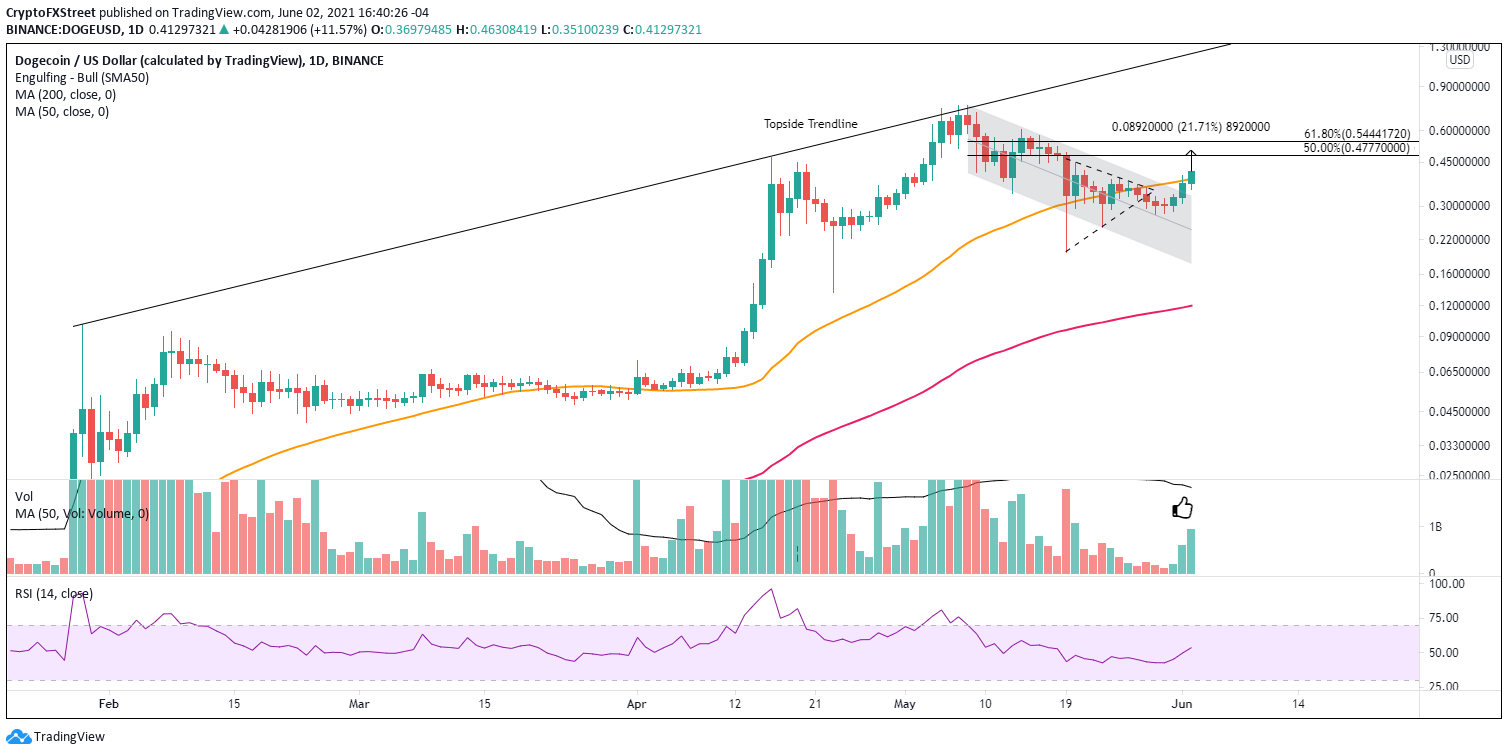
Dogecoin price combines two double-digit days to release from the descending channel that has governed price since May 8. The absence of overbought conditions on the daily or weekly Relative Strength Indexes (RSI) positions DOGE to build on the breakout towards the measured move target.
Dogecoin price breaks with uncertainty
Dogecoin price declined about 75% from the May 8 high at $0.760 to the May 19 low at $0.195, putting it on the higher side of the range for declines in the cryptocurrency complex. However, the digital token did achieve a 130% bounce off the May 19 low into the May 20 high, closing DOGE back above the 50-day SMA. This level was instructive for the price action until May 27, when the meme cryptocurrency declined below the symmetrical triangle’s lower trend line.
The decline below the triangle’s lower trend line on May 28 signaled a high probability that Dogecoin price would pursue a test of the descending channel’s lower boundary. Instead, DOGE drifted slightly lower before initiating a three-day, 50% rally at today’s high.
Dogecoin price has eclipsed the channel’s upper boundary and currently rests above the 50-day simple moving average at $0.414. The measured move target of the channel is $0.500 from yesterday’s price of the upper boundary, representing a 50% rally from the breakout and a gain of 20% from the current price.
Multiple levels of resistance do not confront DOGE before tagging the measured move target. In fact, there remains just one, the 50% retracement of the May correction at $0.477. If the rally extends beyond the target, a notable convergence of resistance including the 61.8% retracement at $0.544 and price congestion from May 10 to May 16 stands waiting.
Bigger ambitions could include the May 8 high at $0.760, the much-discussed $1.00 and the overlooked topside trend line resistance, now at $1.21.
DOGE/USD daily chart
A failure to hold the 50-day SMA may increase the probability that the rally is already complete, but a decline back into the descending channel will confirm it. Additional levels of support include the May 23 low at $0.246 and the channel’s midline at $0.241.
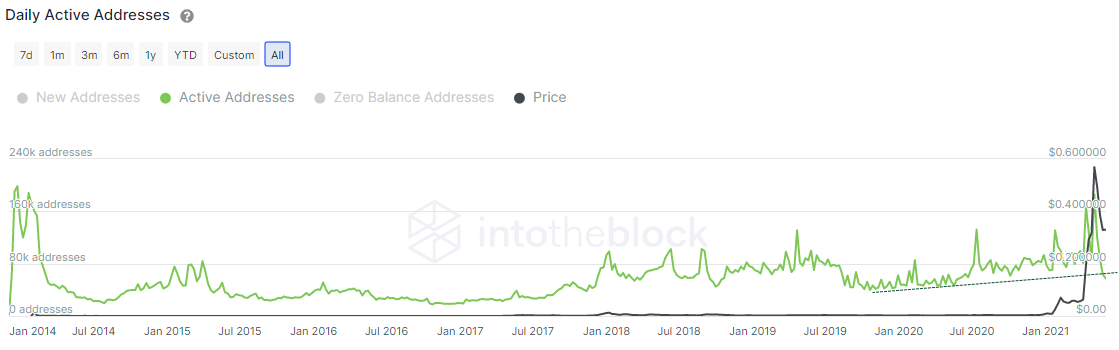
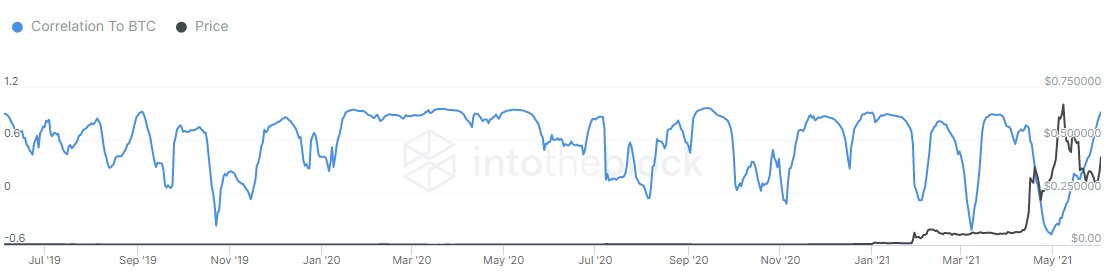
While the bullish sentiment is a welcome deviation after a month of volatility and uncertainty, the correlation of DOGE with Bitcoin is uncomfortably elevated, and the daily active addresses metric shows a lack of interest in the digital asset.
The active addresses metric provides an overview of both user engagement and growth within a cryptocurrency. From May 3 until May 31, the number of daily active addresses fell from 185.78k to 57.83k, representing a 68% decline. The sharp decline shattered the longstanding uptrend from October 2019 pushed the metric down to June 2020 levels. Despite the May decline, investors were not attracted to DOGE, instead opting to reallocate their funds or secure profits.
DOGE Daily Active Addresses - IntoTheBlock
In investing, it is advantageous to identify relative strength during broad market weakness and direct capital allocation accordingly. In the case of Dogecoin price, it has reached a .92 correlation with Bitcoin, an anchor for altcoins. It is the highest correlation since the beginning of January.
Investors want to see DOGE stand on its own. Still, it has fallen under Bitcoin’s sphere of influence without the social media hype and celebrity endorsements, preventing it from already rallying near all-time highs, such as MATIC.
DOGE Correlation to BTC - IntoTheBlock
Dogecoin price action over the last three days has overcome some key technical resistance. Still, it will be interesting to see the up-to-date on-chain metrics and correlation numbers to better evaluate the sustainability of the buyer commitment.
Author

Sheldon McIntyre, CMT
Independent Analyst
Sheldon has 24 years of investment experience holding various positions in companies based in the United States and Chile. His core competencies include BRIC and G-10 equity markets, swing and position trading and technical analysis.



