Dogecoin price starts its engines, DOGE is actionable above $0.195
- Dogecoin price climbed 90% from the June 22 low, topping the cryptocurrency watch list.
- Successful test of the 200-day SMA reveals large investors accumulating on the weakness.
- Daily RSI oversold condition improves the probabilities that a firm low has been printed.

Dogecoin price staged a compelling rebound from the perfect touch of the 200-day simple moving average (SMA), driving DOGE to the previous price congestion level that is reinforced by the 23.6% Fibonacci retracement of the May-June decline. The meme token may experience some residual selling pressure, but as long as the May 19 low holds, DOGE is positioned for higher prices.
Dogecoin price enters the racetrack with bullish intentions
Dogecoin price declined 80% from the May 8 high of $0.760 to the June 22 low of $0.152, placing it among the worst-performing cryptocurrencies during that period, thereby tainting the social media attractiveness of the meme token.
The 36% decline on June 21 shook Dogecoin price from the tight range that defined DOGE for several days, and the magnitude of the drop severed any possible support at the May 19 low of $0.195. However, the bearish outlook got a reprieve on June 22 when Dogecoin price briefly tagged the 200-day SMA at $0.150 and rebounded strongly, indicating that experienced, large investors or institutional investors were entering the market.
Moving averages are used to define support and resistance levels, as well as to define the trend. Still, they also are used to gauge the commitment of astute investors targeting high probability trading opportunities. It is evident by the reaction of Dogecoin price to the 200-day SMA that big investors, not retail investors, were accumulating DOGE.
Adding credibility to the DOGE narrative that defines June 22 as the low is the definitive oversold condition expressed by the daily Relative Strength Index (RSI) on June 21. It marks the first oversold condition for Dogecoin price since March 12, the day before the final low that launched a 400% rally.
Moreover, if Dogecoin regains price traction into tomorrow, it may close the week with a bullish hammer candlestick pattern, further confirming a meaningful DOGE low. It is important to note that single candlestick patterns carry more importance on larger timeframes.
The near-term concern for extending the rally is the strong resistance cultivated by the confluence of the declining trend line from the May high at $0.282 and the 23.6% retracement level at $0.296. The convergence of the two levels halted the Dogecoin price rebound and set DOGE back 10% yesterday.
A close above the two resistance levels puts Dogecoin price on course to test the 50-day SMA at $0.369 and then the 38.2% retracement at $0.384.
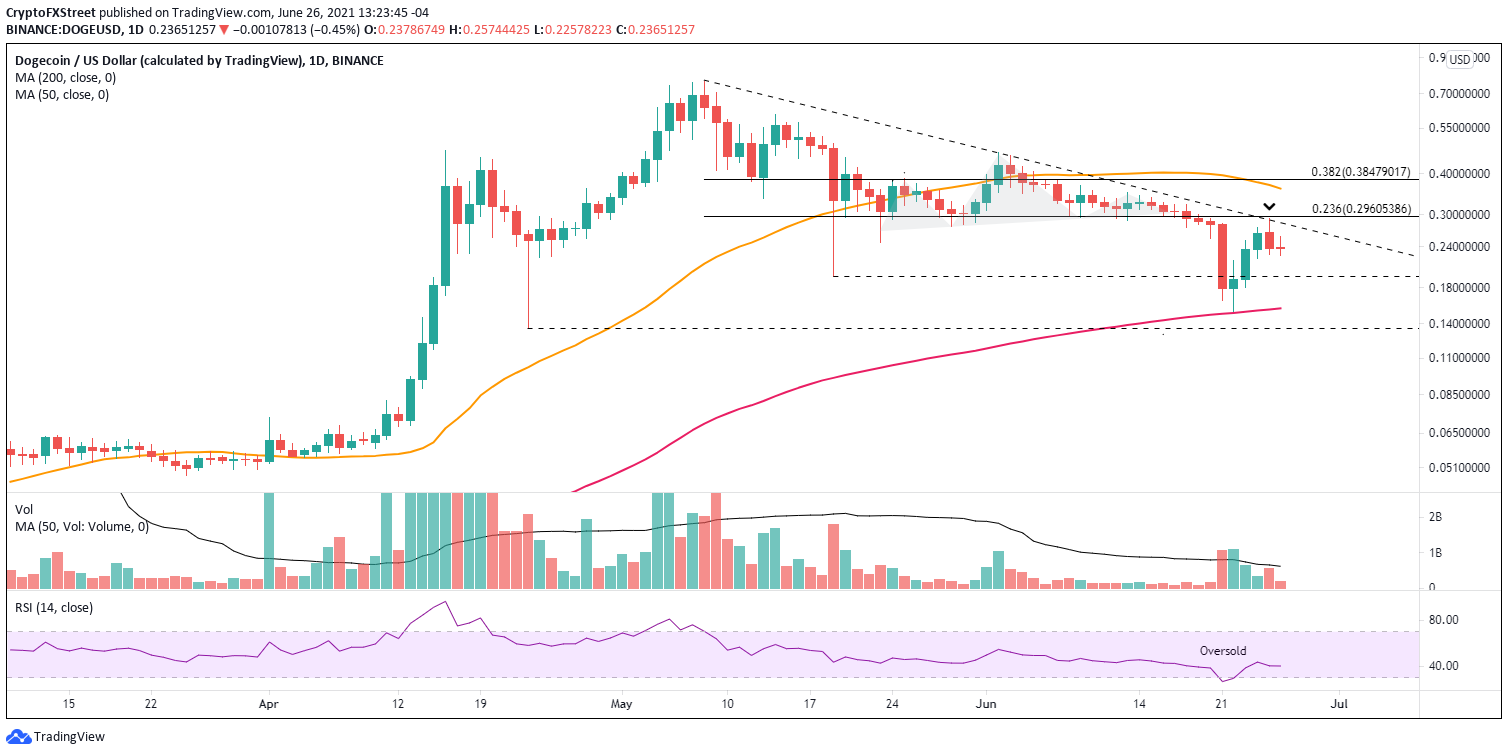
DOGE/USD daily chart
If Dogecoin price closes below the May 19 low of $0.195, it will raise the odds of another test of the 200-day SMA, or potentially a new correction low. Nevertheless, DOGE market operators should use the retreat to accumulate a position.
Dogecoin price, at times, has taken a different path from the majority of altcoins due to social media interference and elevated levels of FOMO. It will always be a factor in every DOGE investment decision. However, the digital asset appears to have established a foundation for higher prices moving forward.
Author

Sheldon McIntyre, CMT
Independent Analyst
Sheldon has 24 years of investment experience holding various positions in companies based in the United States and Chile. His core competencies include BRIC and G-10 equity markets, swing and position trading and technical analysis.



