Dogecoin price heads higher as DOGE breaks above crucial resistance and prints buy signal
- Dogecoin price has swiftly recovered after a steep plunge on June 21.
- The 100-day SMA has been reclaimed as critical support after DOGE dropped below this level a few days prior.
- A critical buy signal from a technical indicator is confirming the bullish outlook.

Dogecoin price suffered a steep drop on June 21, printing a large red candle that erased any hope of reversing a period of underperformance. However, DOGE has since recovered from the harsh decline, a confirmation of accelerating interest from the bulls.
Dogecoin price sees little resistance ahead
Dogecoin price has traded within a topside declining trend line since June 2. This resistance trend line has trapped DOGE in a bearish outlook, as the meme-based coin continued to record lower highs and lower lows on the daily chart.
While Dogecoin price suffered from consistent selling pressure since early June, the steep fall was ignited when DOGE failed to sustain trading above the 100-day Simple Moving Average (SMA), which has acted as support since November.
Breaking below this crucial line of defense led to a 42% decline on June 21, tagging the lower barrier of the demand zone at $0.162.
Now, Dogecoin price appears to be in recovery, printing its fourth consecutive green candle on the daily chart, likely fueled by positive sentiment as DOGE developers introduce a new upgrade for the network.
DOGE has managed to surge above the declining resistance trend line that has trapped the meme coin for almost a month, as well as above the 38.2% Fibonacci extension level at $0.271.
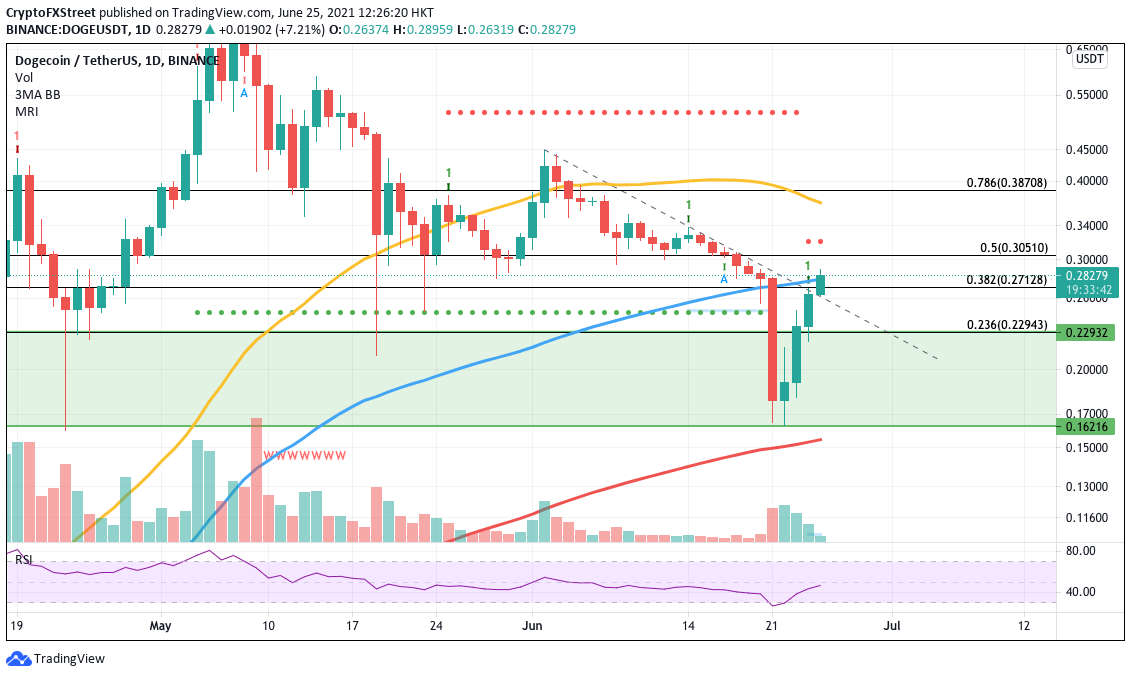
DOGE/USDT daily chart
Investors should also note that Dogecoin price has also rallied above the 100-day SMA, however, only a daily close above this level would confirm further fuel to the upside. The Momentum Reversal Indicator (MRI) also printed a buy signal on the June 24 candle, adding credence to the bullish thesis.
Dogecoin price must continue to trade above the 100-day SMA and the diagonal trend line to raise the probability of DOGE reaching the 50% Fibonacci extension level at $0.305. If this next target is reached and held onto as support, bigger aspirations toward the 50-day SMA should not be voided for the canine-themed coin.
If Dogecoin price fails to close above the 100-day SMA and retreats from the prevailing uptrend, DOGE is likely to retest the 38.2% Fibonacci retracement level before falling toward the start of the demand barrier at $0.229, coinciding with the 23.6% Fibonacci retracement level.
Should Dogecoin fail to hold the aforementioned critical support levels, DOGE price would likely be trapped trading below the declining resistance level, consolidating until a compelling upside release emerges.
Author

Sarah Tran
Independent Analyst
Sarah has closely followed the growth of blockchain technology and its adoption since 2016.