Dogecoin Price Prediction: Is a 40% decline a DOGE discount or early signs of destruction?
- Dogecoin fell by 40% during the US midterm elections.
- Despite the selloff, the Relative Strength Index stands within the grounds of a healthy uptrend.
- All uptrend potential depends on $0.05 holding as support.

Dogecoin price fell aggressively during the US midterm elections. After a 40% decline, investors are questioning what could happen next. Key levels have been defined to determine DOGE’s next potential move.
Dogecoin price plummets
Dogecoin price stunned the Crypto market once again as the world’s favorite dog-themed coin nosedived 40% on November 8 during the Midterm Elections. Although the decline may appear to be the most severe liquidation witnessed this fall, DOGE still has the potential to pull a 180.
Dogecoin price currently auctions at $0.087. The bears have successfully breached both the 8-day exponential and 21-day simple moving averages. A Fibonacci retracement tool surrounding the previous 160% rally in October shows the current price as just a 61.8% correction. The Relative Strength Index is also at the midline, breaching overbought conditions on higher time frames.
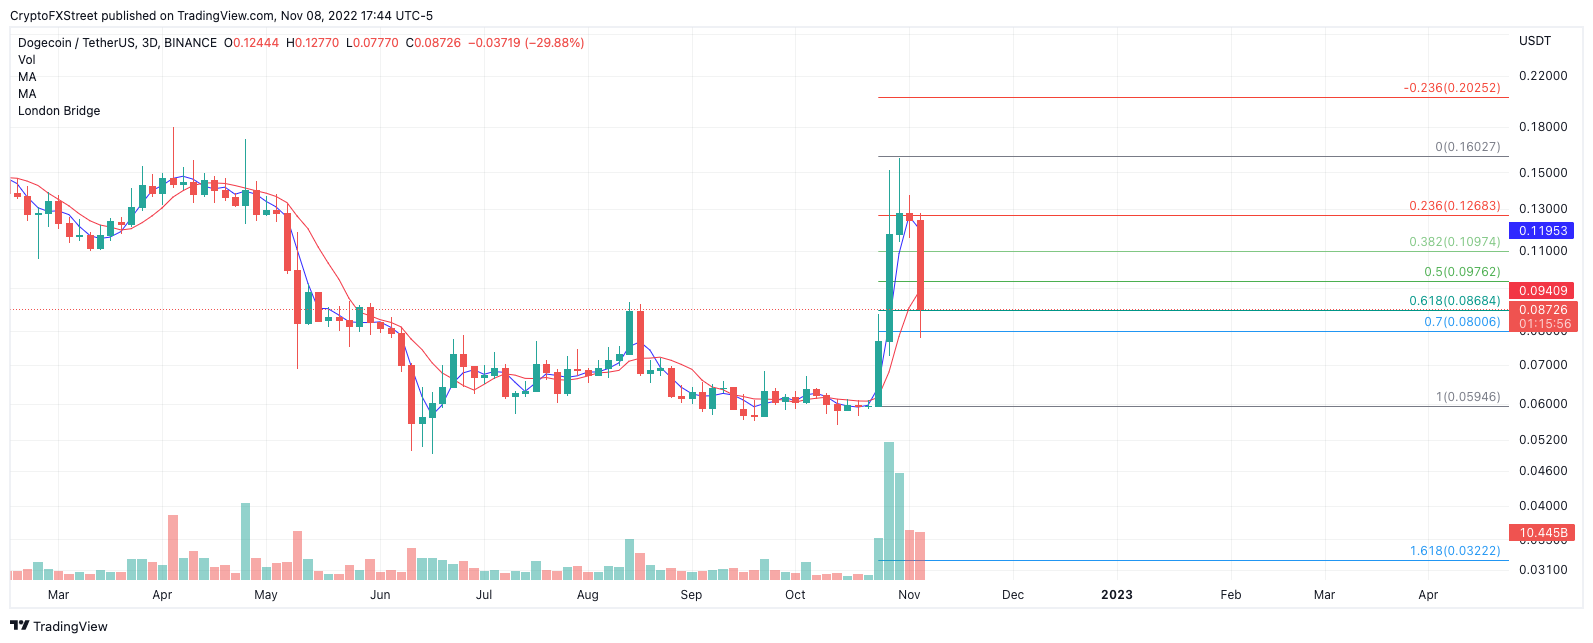
DOGEUSDT 1-Day Chart
Considering these factors, calling an end to the DOGE bullrun of 2022 has yet to be justifiable. If the technicals are correct, DOGE could rally towards $0.17 and potentially $0.20 in the coming weeks. A doji candle near current price levels could signal a subtle accumulation within a downtrend and promote sidelined bulls back into the market.
Still, the health of the uptrend depends on the thrust candle at $0.059 remaining untagged. If the level is breached, an additional downtrend move targeting the June lows could occur at $0.049 will stand a fair chance of occurring. Such a move would result in a 44% dip from the current Dogecoin price.
In the following video, our analysts deep dive into the price action of DOGE, analyzing key levels of interest in the market. -FXStreet Team
Author

Tony M.
FXStreet Contributor
Tony Montpeirous began investing in cryptocurrencies in 2017. His trading style incorporates Elliot Wave, Auction Market Theory, Fibonacci and price action as the cornerstone of his technical analysis.


